(Oil & Gas 360) – The Fast Jump In Natural Gas Prices Determining Who Gets It In A Market Viewed As Well Supplied Highlights Supply/Demand, Consensus-Beating Tight.
While natural gas inventory declined 3 Bcf last week, 3,969 Bcf, 3rd highest in 31 years and only 77 below the record high is helping pretty much all be bearish, believing supply is plentiful. Yesterday morning the Energy Information Administration reported that U.S. working natural gas inventory declined 3 Bcf last week to 3,969 on November 15 (Figure 1, red line). -3 is better than the 4 Bcf injection the consensus expected but a 39 Bcf draw is the average for the week over the prior 30 years of weekly natural gas data. And 3,969 is the 3rd highest November 15 level on record, only 77 less than the day’s 4,045 Bcf record high in 2016 (green line) and 34 less than 4,000 in 2015.

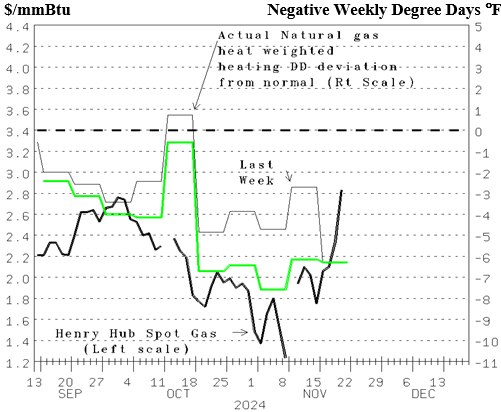
Nevertheless, the Henry Hub spot price jumped $1.09 per mmBtu this week, up to $2.940. The Fall-fall in temperatures taking its time deflated the Henry Hub spot price of natural gas from up near $2.80 to $1.750 per mmBtu last Friday (Figure 2, bold line, left scale). Only one of the ten weeks since mid-September colder than normal (line, right scale) greatly minimizing natural gas demand dropped the price and increased inventory (Figure 1). Was the drop to $1.750 helped by expectations that last week would average 52.3 °F, 6.1warmer than normal (green line, right scale)? And the price rebound helped by it averaging 48.9 (line, right scale)? NOAA’s beginning of the week forecast was another big miss.
By oilandgas360.com contributor Michael Smolinksi with Energy Directions
The views expressed in this article are solely those of the author and do not necessarily reflect the opinions of Oil & Gas 360. Please consult with a professional before making any decisions based on the information provided here. The information presented in this article is not intended as financial advice. Please conduct your own research before making any investment decisions.