Type curves tell a story
American oil production is setting new records, with February’s output of 10.3 million barrels per day breaking a 47-year record.
With rig counts at about half of pre-downturn levels, current output has not come from simply brute force of the turning drill bit. Instead, the downturn forced companies to become more effective—generally meaning more efficient—and the current production is in large part due to an accumulation of those improving efficiencies.
Bakken leads the oil basins
Operations have significantly improved in each of the major oil-producing shale basins in the U.S., the Anadarko, Bakken, Eagle Ford, Niobrara and Permian.

The EIA reports that the Bakken has the highest average first month oil production per new well, narrowly exceeding the Eagle Ford. While the Permian currently ranks third in first month oil production per new well, the basin is rising quickly as operators become more focused on precision completions and are continually re-establishing best practices.
These improvements in efficiency have been nearly constant in every basin for the past ten years, with only a few cases of oil productivity falling year-over-year.
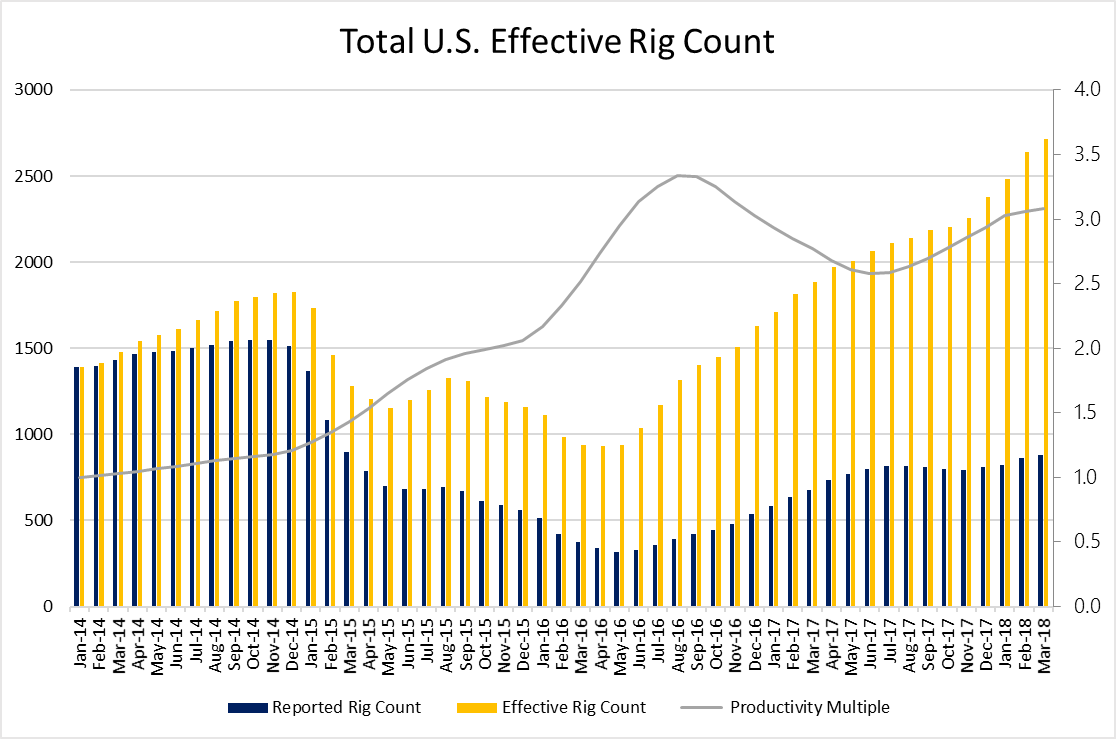
Efficiency improvements add up over time, modern production would require 2,712 rigs delivering 2014’s productivity levels
The improvement in modern operations inspired EnerCom Analytics to create the EnerCom Effective Rig Count, which seeks to express current activity in terms of activity from January 2014. Based on the most recent data available, current operations are more than three times as productive as those from early 2014. While there were 879 rigs in the major shale basins in March this year, it would have taken 2,712 rigs from January 2014 to yield the same level of new production.

Type curves: performance improvements are not created equal – Eagle Ford beating all for faster payback
When comparing the type curves of each basin from 2017 and 2016, it is clear that performance improvements are not created equal.
The Bakken and Eagle Ford, for example, saw roughly equal increases in first month oil production from new wells in the past year. In the Eagle Ford, the productivity improvement is concentrated in the early months of the well, as by six months of operation, the 2017 and 2016 type curves are roughly equivalent.
The recent improvements in the Bakken, by contrast, are felt through a longer portion of the well’s lifecycle. After six months of operation, 2017 Bakken wells were still producing well above the rates seen by 2016 Bakken wells. The extended improvement means the total volume of oil produced by the average Bakken should be meaningfully increased.

While improved production throughout the lifetime of the well is certainly ideal, improving production in only the first months of the well’s lifecycle can have an outsized effect on the economics of the project.
While the total volume of oil produced in the most recent Eagle Ford wells is only slightly improved, higher initial production means the money spent drilling and completing a well is repaid in a shorter time, making the investment more attractive.
Many companies have embraced this opportunity by designing frac jobs to yield higher flowrates even if the total oil and gas produced was unchanged.


