From FreightWaves
The expanded Panama Canal, which can now accommodate larger ships in greater numbers, has altered trade flows on the North American continent.
The expansion, completed on June 26, 2016, doubled the capacity of the Panama Canal. East Coast ports invested billions of dollars dredging their harbors so larger vessels could make calls and adding cranes to accelerate the movement of boxes from ship to shore. Consequently, container volumes for East Coast ports have grown faster than West Coast volumes. About two months ago, the East Coast finally pulled ahead of the West Coast.
This morning we launched a new index in our SONAR freight market data platform that helps track the relative attractiveness of using West Coast or East Coast ports to take in Asian exports—we call it the ‘Panama spread’ (SONAR code: FBX.PANA).
The Panama spread reflects a simple calculation: we subtract the rate to move a container from China to the North American West Coast (FBX.CNAW) from the China to North American East Coast rate (FBX.CNAE). The transpacific trade lane is one of the world’s busiest and most volatile, and container rates are affected by steamship line capacity, demand, and canal fees (both Panama and Suez). The chart below displays the rates in question, along with the spread between them (white line):
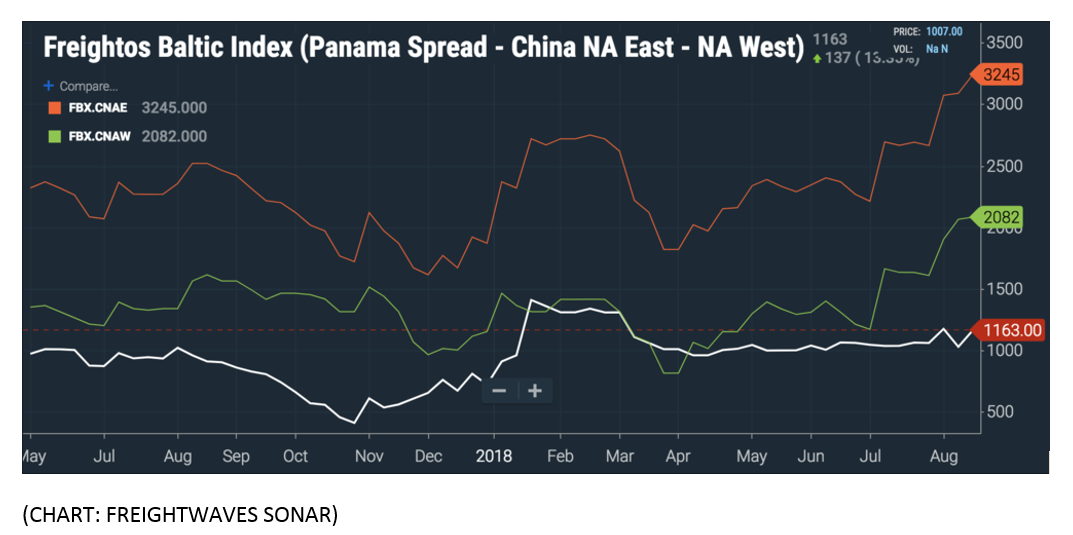
While the rates themselves are volatile due to intuitive factors like freight and capacity imbalances, the spread is also highly volatile. At the end of October 2017, FBX.PANA had fallen to about $410; less than three months later on January 21, 2018, the spread had spiked to just over $1,400, an increase of 250%. The Panama spread in its natural habitat, in those increasingly rare periods of normalcy, should settle around $1,000, but there is a dense web of other factors that cause the spread to shrink or widen.
Competition between canal infrastructure for volume and revenue is one dynamic affecting the Panama spread. In late 2017, the Panama Canal’s traffic continued ramping up.
Political instability and mismanagement in Egypt, Suez Canal
Meanwhile, on the other side of the world, political instability and financial mismanagement intensified pressure on Egyptian President el-Sisi to deliver economic benefits to Egyptians. The Suez Canal—which was expanded in 2015—drastically cut its fees, causing the Panama spread to collapse. Revenues from canal infrastructure have an outsized important for developing countries’ fragile economies.
Panama’s government collected revenues of about $12.6B in 2017, and canal tolls alone are expected to grow to $2B in the next few years. Beyond the canals’ economic importance to their countries, internal politics also affects the tolls imposed on ship traffic.
Where international shippers’ profits go to die
Besides the Arab Spring, sham elections, and post-colonial politics, there’s another major source of volatility for the Panama spread: the American trucking market, where international shippers’ profits go to die.
From an international perspective, the American trucking market is fragmented, opaque, and expensive. Ferocious competition between carriers for spot action makes contract agreements tenuous; thousands of small operators make visibility into shipment locations difficult; fuel, distance, and labor costs make moving goods across the American interstate system extremely expensive compared to other modes.
Specifically, trucking spot rates from West Coast and East Coast ports to the middle of the country affect the desirability of shipping containers into those regions.
An example: Los Angeles to St. Louis and Savannah to St. Louis
According to DAT’s RateView tool, over the past seven days a dry van going from LA to St. Louis cost an average of $1.60 per mile, excluding fuel surcharges. From Savannah to St. Louis, the rate was $1.48 per mile. But wait, there’s more: St. Louis is 1,827 miles from LA, but only 804 miles from Savannah. Therefore, net of fuel, over the past seven days it cost an average of $2,923 to move a truck from LA to St. Louis and $1,189 to move the same truck from Savannah to St. Louis.
The Savannah-St. Louis lane enjoys a $1,734 discount over the Los Angeles-St. Louis lane, a figure exceeding the Panama spread for container rates. If you subtract the current Panama spread ($1,163) from the trucking rate spread, you come up with $571.
Right now, $571 is a rough measure of how much cheaper it is to move goods from China to the centrally located American freight hub of St. Louis through East Coast ports rather than West Coast ports.
We’ve excluded data points like drayage costs and transit times from our calculus because commodities and consignees have varying levels of exposure to time sensitivity. It takes about 15 days to ship a container from Shanghai to Los Angeles, and either 21 or 28 days to ship a container from Shanghai to Savannah, depending on whether the Panama or Suez Canal is used. Most retail goods are not that sensitive to time, but auto parts and temperature-controlled food shipments normally run on tight schedules.
West coast woes: Los Angeles has one of the highest diesel prices in the country
We could add another wrinkle (and increase the discount enjoyed by the Savannah-St. Louis lane) by noting that the Los Angeles market has some of the highest diesel fuel prices in the country. SONAR data shows that the diesel truck stop actual price paid in Los Angeles is $3.96 per gallon, while in Savannah diesel only costs an average of $3.16 a gallon.
Individual shippers, carriers, and their customers are all trying to figure out how to move freight efficiently and inexpensively, and there are a host of variables influencing their decisions. The transpacific container trade has been on a major bull run since April, helped by the major alliances’ decisions to pull capacity from the lane and cut services. Demand shows no signs of slowing down, and just last week Splash 24/7 reported that cargo is being rolled on transpacific services, meaning that freight meant for one vessel is being pushed back to a later sailing because of a lack of capacity on the intended ship. That’s a healthy sign for steamship lines looking to reverse their losses from the first half of the year, but it makes finding cost savings even more important for shippers and their consignees.
The large inbound volumes have meant a historically tight capacity environment for intermodal rail service off the West Coast. The analysis in this article does not include rail pricing or intermodal spot rates, but assumes a standard path from port to local distribution center, where the container is broken down and built into truckloads.
SONAR’s Panama spread, especially when compared to trucking spot rates in the United States, reveals the basic monetary incentives to pick one route over another. It’s an especially vital tool now that West Coast and East Coast container volumes have reached an unprecedented inflection point and flipped.