Chart Watching: a Hobby Resurrected
Oil price has been on a tear as of late with market watchers picking away at any scrap of data coming from the oil sector as to when the market will balance. WTI prices have increased in the neighborhood of 70% since hitting a low around $27 three months ago. There have been several catalysts that could claim credit for the rise in price; The U.S. dollar has weakened, OPEC has discussed a production freeze, U.S. storage hasn’t been rising as fast as it once was, rig count is way down, and producers in the U.S. are pulling less oil out of the ground.
Predicting the path of oil price going forward seems to dictate the analysis of a large number of factors and potential hiccups that may send prices on an altered path. Or the answer could be much simpler than that?
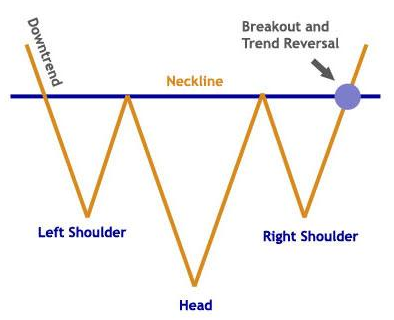
Analyzing chart patterns has become a piece of technical analysis that some people trade on with regularity. Much like any other prognostication tool, it has its ups and down (yes, that was a bad attempt at a chart pun). However, particular patterns have become a fairly reliable tool, one of those patterns is the head and shoulders pattern.
In a textbook, an inverse head and shoulders move would be described by the image below:
Over the course of the last year, oil price has shown signs of a similar trend. In general pricing terms, one year ago, oil was hovering around the $60 per barrel mark. Prices then dipped in August 2015, reaching a low just above $38 per barrel, only to rise and hover in the neighborhood of $45 per barrel.
This trend continued until late October 2015, when prices began to fall yet again until it hit $26 per barrel in late January and early February. Since early 2016, prices have been on the rise, recently reaching the $45 mark again.
If the head and shoulders trend is the forward path of oil price, the implication is that oil may hover for a very short term around $45 per barrel only to dip below $40 in the near term. The reversal of price from that mark and a rise above $45 per barrel would mark the breakout of oil price. A return to $60 per barrel would complete the textbook head and shoulders trend.
Certainly the possibility exists that a major change in the oil sector will trigger a move to throw off any trend, it has happened before. But leaning on technical analysis and chart watching, the marks are lining up for a potential recovery. Indications such as U.S. production falling to a new low, lack of wells being actively drilled, fires north of Edmonton, and international producers like Libya and Venezuela showing signs of stress, the possibility to complete a head and shoulders trend and return to $60 per barrel could just become a reality.


