Over the past two weeks, Oil & Gas 360® has reviewed eight of Canada’s E&Ps, looking at operations, financial performance and management comments during recent conference calls. The Canadian E&Ps we will review range in market cap from $44 billion to $109 million. Today, OAG360® looks at four more companies focused on developing Canada’s crude oil and natural gas resources.
Canadian Oil Sands Limited (COS)
Comparative Financial and Operational Metrics for COS (approximate numbers): Canadian Oil Sands Limited’s enterprise value is $10.3 billion. Trailing twelve month (TTM) production is 90.4 MBOEPD, with 2013 proved reserves of 735 MMBOE. The company’s production is 100% oil and liquids. TTM CapEx as of September 30, 2014 is $1.1 billion. TTM EBITDA as of September 30, 2014 is $1.5 billion. The company’s balance sheet at the end of 3Q 2014 reported debt of $1.9 billion. Net debt / TTM EBITDA = 1.1x.
Canadian Oil Sands is a pure light, sweet crude oil investment opportunity. The company owns a 36.74% interest in the Syncrude Project, located in northeast Alberta, representing the largest portion of the project held by one company. The Syncrude Project is a joint venture among the following oil and gas companies:
- Canadian Oil Sands Partnership #1 (36.74%)
- Imperial Oil Resources (25%)
- Suncor Energy Ventures Partnership (12%)
- Sinopec Oil Sands Partnership (9.03%)
- Nexen Oil Sands Partnership (7.23%)
- Mocal Energy Limited (5%)
- Murphy Oil Company Ltd. (5%)
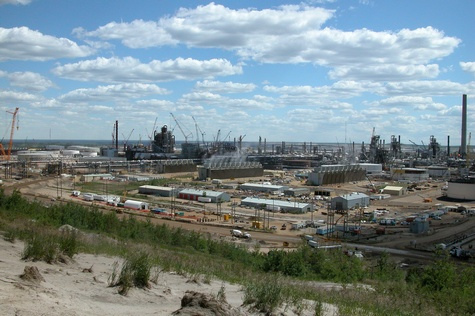
The Syncrude mining operations and upgrading facility are located 40 km north of Fort McMurray in northeast Alberta. In its Q3 2014 report, Canadian Oil Sands reported cash flow for the quarter of $302 million, and net income of $87 million. Sales volumes for the quarter averaged 87,787 BOPD, compared with 84,250 BOPD in Q3 2013.
Speaking on Sep. 9, 2014, at Peters & Co. Energy Conference, Robert P. Dawson, Chief Financial Officer said:
“Canadian Oil Sands is focused on our ownership in the Syncrude project. It’s our only asset, so it represents 100% of our production. And we see Syncrude simply providing our investors with a number of key advantages. First, we benefit from an established base of production. The assets are already in the ground today, and they’re generating cash-paying dividends.
“Second, it is an integrated mining project, and an upgrader that converts all of our production to a light, sweet synthetic crude oil. As such, our product is not exposed to volatile light-heavy oil differentials that a number of other producers in the oil sands are.
“And third, using proven mining technology … Syncrude predictably recovers about 90% or more of the bitumen in its deposits. So it has a greatly reduced reservoir risk. These fundamentals of the Syncrude asset are difficult to replicate and we believe they’ll continue to generate value for investors in the years to come. Our proved plus probable reserves alone represent more than 40 years of production based on current rates. So we’re talking about a quality asset with non-declining production for many more decades.”
Strategic Oil & Gas (SOG)
Comparative Financial and Operational Metrics for SOG (approximate numbers): Strategic Oil & Gas has an enterprise value of $265million. Trailing twelve month (TTM) production is 2.5 MBOED, with 2013 proved reserves of 6 MMBOE. The company’s production is 40% natural gas, 60 % oil and liquids. TTM CapEx as of September 30, 2014 is $93 million. TTM EBITDA as of September 30, 2014 is $11 million. The company’s balance sheet at the end of 3Q 2014 reported debt of $65 million. Net debt / TTM EBITDA = 5.8x
Strategic’s focus during the third quarter was on continuing to develop the Muskeg oil resource through horizontal drilling at Marlowe in northern Alberta. The Company’s summer program was highly successful, resulting in six oil wells, all of which were on production by early October 2014. Strategic was able to reduce drilling times and costs relative to the winter capital program, with drilling, completion, equipping and tie-in costs now averaging $3.8 million per well compared to over $5.0 million in the first half of the year.
Strategic operates primarily in the Muskeg and Marlowe plays in northern Alberta. In Q3 2014, the company reported an average daily production of 3,480 BOEPD and an operating netback of $25.11 per BOEPD. Strategic also reported a net income of $213,000, up from a loss of $6.8 million in Q3 of 2013.
In a Management’s Discussion and Analysis for the three and nine months ended September 30, 2014, released by Strategic, the company said:
“Production continued to increase during the course of the as new wells were brought on stream, and average sales volumes were approximately 4,100 BOEPD for October 2014. Strategic is encouraged by its recent success in the Muskeg program and is maintaining its 2014 exit production guidance at 4,600 BOEPD.
“Strategic’s Board of Directors has approved a capital expenditure budget of $52 million for the first half of 2015, focused on continued development and extension of the Muskeg fairway in northern Alberta. Key highlights of the company’s capital program and guidance for the first half of 2015 are as follows:
- Drill up to 14 wells in the first six months of 2015. Strategic plans to start a second rig in December 2014 and continue drilling with two rigs during the first quarter of 2015. The drilling program consists of 10 horizontal Muskeg wells and up to 4 vertical wells;
- First half of 2015 average production of 5,000 BOEPD;
- First half exit production in 2015 targets of 5,400 BOEPD.”
Lightstream Resources Ltd. (LTS)
Comparative Financial and Operational Metrics for LTS (approximate numbers): Lightstream Resources Ltd.’s enterprise value is $2.2 billion. Trailing twelve month (TTM) production is 36.5 MBOEPD, with 2013 proved reserves of 124 MMBOE. The company’s production is 21% natural gas, 79% oil and liquids. TTM CapEx as of September 30, 2014 is $511 million. TTM EBITDA as of September 30, 2014 is $783 million. The company’s balance sheet at the end of 3Q 2014 reported debt of $1.4 billion. Net debt / TTM EBITDA = 1.8x
Lightstream Resources is a light oil-focused exploration and production company with principal operating areas in southeastern Saskatchewan, where it is targeting the Bakken formation, central Alberta, where it focuses on the Cardium formation, and north-central Alberta, where the company has begun development of the Swan Hills and is engaged in exploring for light-oil resource plays.
The company has probable reserves of 178 MMBOE and a drilling inventory of over 1,950 locations. In 2013, the company had an average production of over 46,400 BOEPD, with an operating netback of $50.00/BOE. Lightstream generated over $670 million of funds flow from operations. Lightstream completed significant sales of non-core assets in 2014.
Speaking on Oct. 31, during the company’s third quarter conference call, Peter D. Scott, Senior Vice President and Chief Financial Officer, said:
“In 2014, we have now sold CAD720 million ($640 million) of non-core assets, CAD476 million ($423 million) of which occurred during the third quarter. This largely completes our planned program and we are pleased with the value that we generated for these assets obtaining higher proceeds in a shorter timeframe than originally contemplated. Overall, we have sold more than 6,300 BOEPD of production, 20% gas weighted, 6.5 times cash flow and CAD39 ($34.66) per BOE of proved plus probable reserves of with only CAD5 ($4.44) per BOE related to future development capital.
“[Lightstream] has focused our operations on three significant light oil resource play assets –the Cardium, Bakken and Swan Hills–while only reducing our reserves by 10%, production by 15%, but [we have reduced] our liabilities by 25%. The proceeds from these dispositions along with the excess cash flow we generated to date have been used to reduce our total debt by 31% to approximately CAD1.5 billion ($1.3 billion). The interest savings associated with this debt reduction is expected to be at least CAD25 million ($22 million) per year. In addition, with the dispositions, our liquidity position has improved and September 30 we had approximately CAD660 million ($587 million) of credit available under our secured credit facility.”
Peyto Exploration & Development Corp. (PEY)
Comparative Financial and Operational Metrics for PEY (approximate numbers): Peyto Exploration & Development Corp.’s enterprise value is $6.5 billion. Trailing twelve month (TTM) production is 66.8 MBOEPD, with 2013 proved reserves of 304 MMBOE. The company’s production is 86% natural gas, 14% oil and liquids. TTM CapEx as of September 30, 2014 is $615 million. TTM EBITDA as of September 30, 2014 is $617million. The company’s balance sheet at the end of 3Q 2014 reported debt of $885 million. Net debt / TTM EBITDA = 1.4x
Peyto’s wells, gas plants, gathering and sales pipelines exist in a corridor about 125 miles long and 20 miles wide right by the foothills of the Rockies, running through Alberta and into parts of British Columbia. In the beginning of 2014, Peyto was producing at 75,000 BOEPD, and was expecting to add another 32,000 BOEPD to 36,000 BOEPD to production by the end of 2014.
Speaking on Nov. 13, during the company’s third quarter conference call, Scott Robinson, Chief Operating Officer and Vice President of Operations, said:
“[Our] really good news here is our production. We’re at about 85,000 or thereabouts now, but the growth has been very impressive. And if you take it apart and look at it over the last several months, to recap, we started Q3 at about 72,000. We grew to 80,000 barrels. And then, more recently, we’ve made another quantum jump to about 85,000, 86,000 barrels a day thereabouts on a daily basis.
“Our drilling and our facility projects have really fallen into place very nicely, and they’ve enabled us [to accomplish] this continued growth. In fact, this past weekend, we completed a fairly important project, the connection of our South Brazeau acreage to our gas pipeline. It’s very strategic, and it allowed us to take this most recent jump in production.”
During the same conference call, Darren Gee, Chief Executive Officer, President and Director, said:
“The big reason I think that we can do so much is that we always have a very good game plan and the risk that we don’t get what we’re planning is actually very low. We’ve always stated that our strategy from day 1 has been low-risk, repeatable, predictable returns.
“Some might say that being so predictable and being so repeatable and low-risk is boring because then we’re not using the latest, greatest technology that they can’t write about, and we’re not chasing the hot new play. But quite frankly, I don’t care. I mean, low-risk, repeatable, predictable, that’s how we’re able to accomplish what we have with this lean and efficient team.”
Read Part One of the series here; Part Two here.
Important disclosures: The information provided herein is believed to be reliable; however, EnerCom, Inc. makes no representation or warranty as to its completeness or accuracy. EnerCom’s conclusions are based upon information gathered from sources deemed to be reliable. This note is not intended as an offer or solicitation for the purchase or sale of any security or financial instrument of any company mentioned in this note. This note was prepared for general circulation and does not provide investment recommendations specific to individual investors. All readers of the note must make their own investment decisions based upon their specific investment objectives and financial situation utilizing their own financial advisors as they deem necessary. Investors should consider a company’s entire financial and operational structure in making any investment decisions. Past performance of any company discussed in this note should not be taken as an indication or guarantee of future results. EnerCom is a multi-disciplined management consulting services firm that regularly intends to seek business, or currently may be undertaking business, with companies covered on Oil & Gas 360®, and thereby seeks to receive compensation from these companies for its services. In addition, EnerCom, or its principals or employees, may have an economic interest in any of these companies. As a result, readers of EnerCom’s Oil & Gas 360® should be aware that the firm may have a conflict of interest that could affect the objectivity of this note. The company or companies covered in this note did not review the note prior to publication. EnerCom, or its principals or employees, may have an economic interest in any of the companies covered in this report or on Oil & Gas 360®. As a result, readers of EnerCom’s reports or Oil & Gas 360® should be aware that the firm may have a conflict of interest that could affect the objectivity of this report.
