The dreaded surplus is only 3 days’ production
Global oversupply in the oil market has almost become a curse word in the oil and gas industry. Since the OPEC decision to maintain output levels on November 28, 2014, the industry has seen storage numbers rise and commodity prices fall.
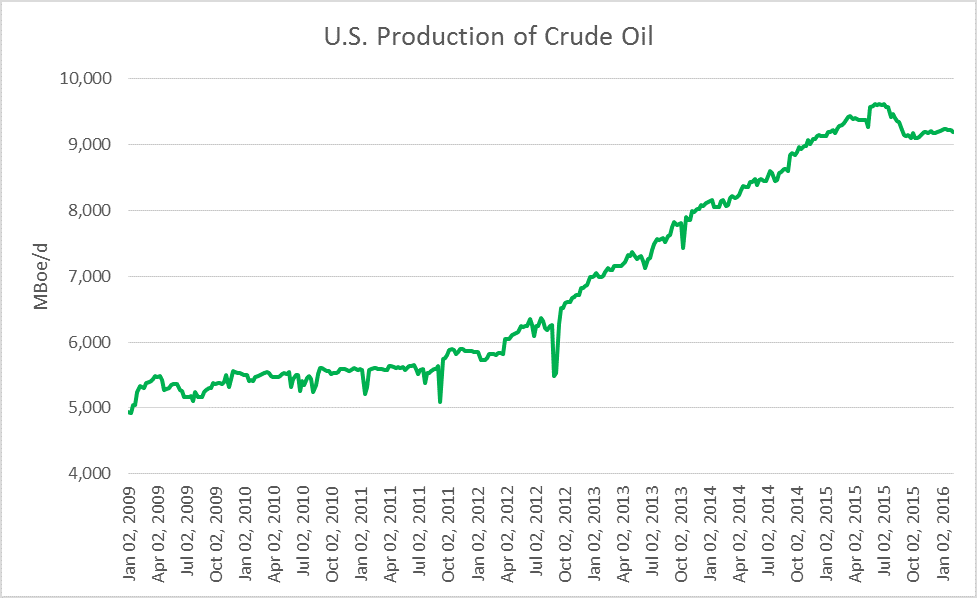
Increased U.S. production and a global battle for market share have been largely blamed for the oil glut. Since the beginning of 2009, U.S. oil production has almost doubled according to numbers from EIA. This has displaced oil that had been imported from places like Saudi Arabia, Nigeria, and Algeria, and it has heated up the competition for market share in the Asian and European markets.
With increased production coming from Iraq, Canada, and Russia, and the potential for more coming online in Iran, tensions over market share have increased dramatically.
The Paradox
In Economics 101 you learn the correlation between supply and demand. When supply is up, and demand is down, prices will be depleted. It would follow to ask why there is so much resistance to cutting supply in an effort to improve commodity prices? On the surface, an easy answer is the desire to maintain market share in a hypercompetitive environment is the producers’ priority.
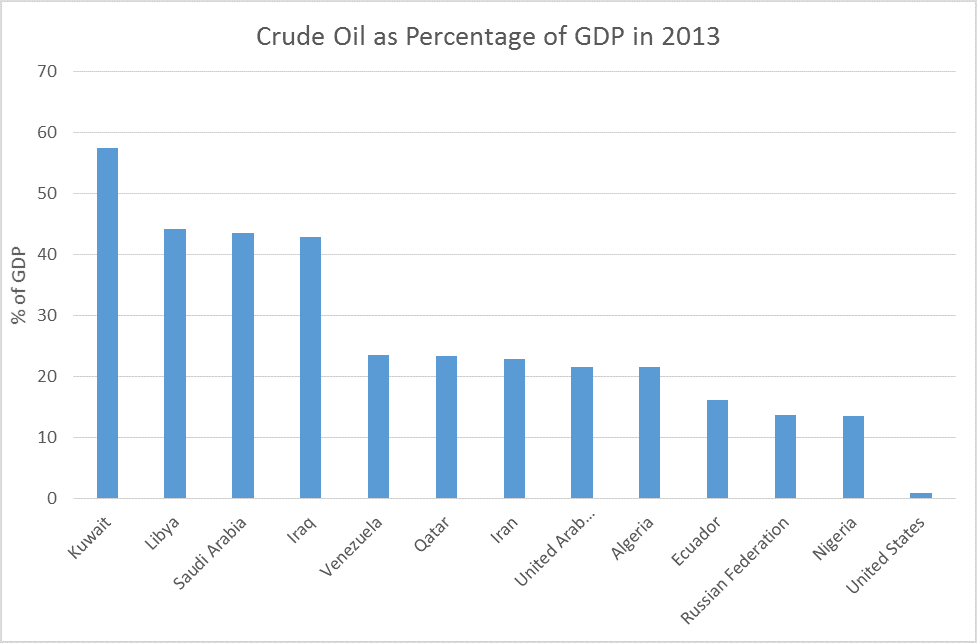
To take it one step further, several of the countries fighting for market share—Saudi Arabia, Iraq, Venezuela and Russia—are petrostates who largely depend on the outflow of oil to maintain their national economies. According to World Bank, in Saudi Arabia, 44% of GDP is derived from the production and sale of crude oil, which equates to $326.3 billion of the kingdom’s $748.4 billion total GDP in 2013.
The paradox comes from the argument that depleted prices helps no one. If countries are reliant on oil and gas revenue to maintain GDP, then depleted prices are a detriment. However, the battle for market share is by no means a temporary thing.
Consistency and stability are key factors for customers who purchase energy. Following a change in supplier, changes are likely to stick until a price war or a supply disruption were to unseat it. The continuity of the supply chain lends to the ferocity of the battle for market share. 
The Balance of Production and Consumption
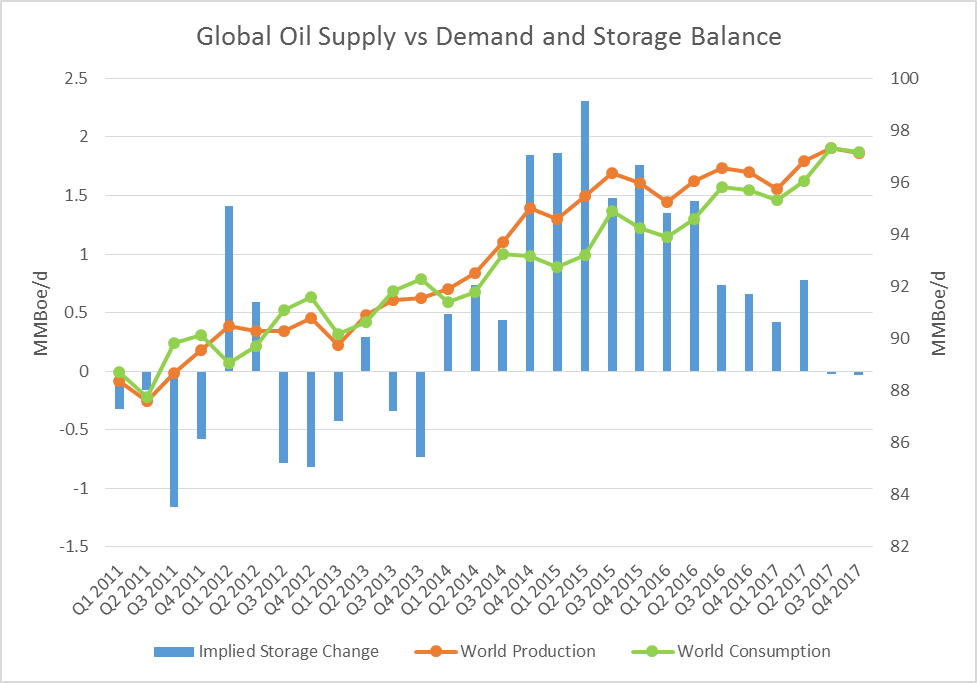
Prior to 2014, supply and demand stayed largely in balance as they increased along a similar continuum. In the chart below you can see upswings in world oil consumption. Often, an upswing in demand is followed by a short term correction and then another upswing. The production of oil has tended to follow this pattern as well, as indicated by fluctuations in the storage balance. But things fell ‘out of whack’ in the latter part of 2014.
Many blamed the United States and its increase in production. During 2014, the U.S. added nearly one million barrels of oil per day to their production totals, and over 3.2 million barrels a day since the beginning of 2012. Many assigned the U.S. the label of swing producer and assigned blame accordingly. Several monarchs in the Middle East would have the world believe that the benevolent hand of OPEC was largely to credit for the market maintaining balance for so long.
Aside from playing the blame game, the course of the global supply and demand has decidedly shifted. Increased fuel efficiency in automobiles worldwide, along with the increased efficiency of solar, hydro, and wind power could all act as catalysts in the flattening of demand. But the question remains, what needs to change to regain a balance in oil supply?
Cutting Production in a Context of Oversupply
In Q4 2014, the U.S. land rig count stood at 2,086 and has since fallen to 534 as of February 12, 2016, a decrease of 74.4% according to RigData. While this hasn’t been mirrored in the production output in the U.S., this has ceased growth and production has remained flat. OPEC announced an agreement on Tuesday February 16, 2016, whereby producers would halt production increases going forward. This does not completely curtail the oversupply, but it is a step in the right direction to allow demand to catch up to supply.
To put the term oversupply into context, the world currently consumes roughly 95 million barrels of oil per day. According to IEA, global inventories rose by a notional one billion barrels through the course of 2014 and 2015 combined, with projections of a continued build of 285 million barrels in 2016.
Only 3 Days’ Production
Here’s what it means: if something were to prevent the production of the world’s oil for three days in 2016, the dreaded surplus would vanish. If a catalyst were to prevent the production of oil for 11 days, the entire build in global supply that occurred in 2014 and 2015 would be entirely negated. Granted, such an event that would cause the complete negation of global output for a series of days or a week or two is largely unfathomable.
But changes are taking place in the oil industry worldwide, albeit at a slower pace. Projects are being shelved, production is decreasing, and demand is expected to continue to rise through 2016 and 2017. One could assess the situation as a supply glut, however, the total glut represents only a few days of production. Going back to economics 101, the function of the supply and demand curve will find a new balance in the global oil markets, pricing will rebound accordingly when that happens and the industry will continue working in a new oil reality.
The good news according to the Short-Term Energy Outlook from EIA – balance will return to the market in late 2017, which is just long enough for the new U.S. president to get his or her feet wet.


