RarePetro
Oil & Gas 360 Publishers Note: This is an outstanding piece from Kevin about world oil costs and what the countries need to make in order to keep up with their social programs. We have been covering this topic, and Kevin has articulated the points very well. Many countries base their social and military spending almost solely on revenue from fossil fuels
Abstract
The cost to produce a barrel of oil varies throughout the world and impacts the determination of global benchmark prices. If only a portion of global supply is economic at current commodity prices, global demand will be what influences the price floor. Once inventories are drawn down, supply/demand economics will drive up the price of oil to ensure supply can meet demand. Be sure to check out the periodical below for an in depth analysis of the economic price to produce a barrel of oil around the world, and why global demand will be the driver for oil prices to set a $55-60/bbl floor for the foreseeable future.
Introduction
Not all barrels of oil are created equal. Some parts of the world produce light and sweet crude while others produce oil that is heavy and sour. The result is price differentials for the varying oil blends throughout the world. On top of selling blends at a premium or discount to others based on quality, the cost to produce a barrel of oil varies widely across the world. This sets up winners and losers when the price of crude fluctuates to historically low levels. The breakdown in costs vary by location as a result of capital expenditures, production costs, administrative and transportation fees, and gross taxes. With various breakeven costs of so many global oil blends, how much oil can economically be supplied to meet global demand at various oil price tiers?
Price Explanation
Before investigating the price breakdown for various areas of the world, the difference between the cost to produce a barrel of oil and the fiscal breakeven price must be identified. An oil-exporting country’s fiscal breakeven oil price is the minimum price per barrel for a country to meet its expected spending needs while balancing its budget [1]. Some of the world’s biggest petroleum producers need to sell oil at a certain price to balance their budgets. A wide gap exists between the prices at which different producers break even. Government spending cuts and deferred projects have helped lower the breakeven price for countries like Saudi Arabia, but some countries still need oil prices above $100 a barrel to balance their budgets [2].
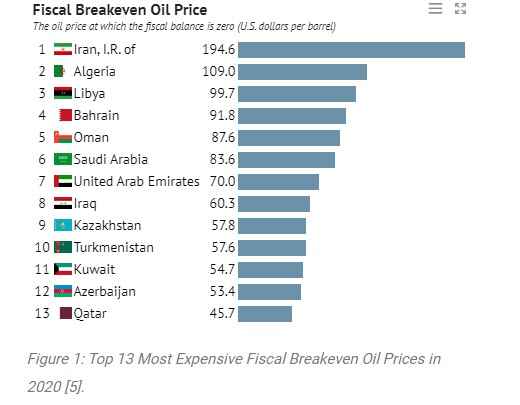
As seen in Figure 1, even though Saudi Arabia has one of the lowest oil production costs, their fiscal breakeven price is much higher since they need approximately $83.60 oil for a balanced budget. This is further proven by the fact that Saudi Arabia lost an estimated $12 billion in April 2020 compared to the previous year as a result of depressed prices [3]. Additionally, the IMF expects the Saudi economy will crash by 6.8% this year, instead of an initial estimate of a 2.3% decline because a huge portion of the economy is influenced by the price of oil [4]. If oil cannot be sold at $83.60 in 2020, they will not have the revenue to meet expected spending needs to ensure a balanced budget. This periodical investigates the base cost to produce a barrel of oil instead of fiscal breakeven cost since several oil producing countries in the world like the United States do not require oil revenues to balance their budgets.
[contextly_sidebar id=”pjcTwDB2AzceRnxIHdGM2PGmkPeJh9sE”]
A simple investigation into the production cost for a barrel of oil has many factors that play a role, even without the fiscal costs associated with a nation’s budget. The cost to produce one barrel of oil can be broken down into four major categories: capital expenditures, operational costs, administrative and transportation fees, and gross taxes. Capital expenditures are the costs to secure physical assets or upgrade current assets. These costs typically take two forms; maintenance expenditure, in which a company purchases assets that extend the useful life of existing assets, and expansion expenditure, in which a company purchases new assets in an effort to grow the business [8]. Depending on the company, this capital expense may take different forms like buying equipment to change lift method, drilling and completing new wells, or purchasing leases or wells. Operations or production costs are the costs associated with daily well operation to bring hydrocarbons to the surface. These kinds of expenditures can include costs for disposal of water, remedial wellwork to repair failures, chemicals and other treating services, or regulatory and preventative maintenance in the field. The final expense categories are fairly straightforward. Administrative costs, or G&A, are generally costs tied directly to operating the business and paying personnel. Transportation costs are expenses incurred to move the hydrocarbons to a sale point, and gross taxes are the various taxes and/or royalties paid on produced hydrocarbons. Since no two wells are exactly the same, it makes sense these varying costs change by location and country. Although Norway spends over twice as much per barrel of oil on capital expenses than a country like Venezuela, the cost to produce a barrel of oil in Venezuela is significantly more since gross taxes are almost ten times lower in Norway.
Global Production Prices
The world has changed for oil producers. When crude-oil prices were more than $100 a barrel the associated profits were huge. Now current prices often barely cover the average lifting cost to get oil out of the ground in many places around the world. With additional expenses like transportation fees and taxes on revenue, the actual production cost for many projects is higher. Newer, more complex projects generally fall well above the production revenue at current oil prices to generate cash flow. By investigating the cost to produce one barrel of oil in various parts of the world combined with production at the time, a picture of oil price levels in the future begins to unfold.
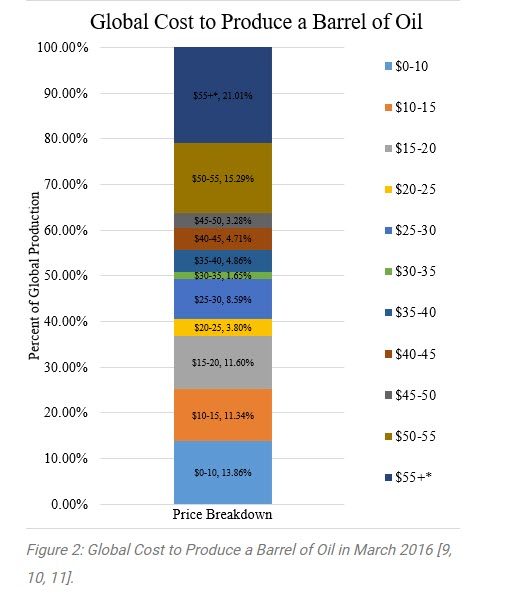
At current levels of WTI hovering at $40/bbl, only about 55% of global oil can be produced below the breakeven price. That means the world can only economically supply 55% of oil demand because production above $40/bbl would lose money. It is important to note the cost of production for about 21% of global oil production could not be quantified for this analysis due to lack of data. As a result, it is assumed the unknown production breakeven price is above $55/barrel. In order for necessary global supply to economically remain at stable levels, prices must climb into the $55 range and remain there.

Even at the peak of the pandemic when a staggering 22% oil demand destruction occurred, current oil prices at $40/barrel likely only support 55% of economic oil production. The remaining 45% of necessary global production demand is simply uneconomic to produce. At depressed prices, global inventories will quickly begin to draw down, and the price of crude must rise as demand increases to outpace supply. As this occurs, more and more global players will be able to produce economically, and a price point balanced by supply and demand will once again be achieved. It is important to note that all countries analyzed in Figures 2 and 3 with the exception of the United States represent 2016 data sources. Breakeven costs for the U.S. have been adjusted to estimate current expenses since production costs have more than doubled due to changing completion strategies and aging wells in tight shale production.
Conclusion
While current price levels ensure about 55% of existing global production can still be profitable, it is not sustainable as demand continues to grow. The cost to produce a barrel of oil does not account for the exploration of new areas. Horizontal wells decline from peak production shortly after they are brought online, meaning natural decline will cause global supply to fall if reserves are not replaced through drilling. As a result, there will not be enough oil produced to keep up with global demand. Additionally, fields can only support a limited number of wells before the reservoir eventually is depleted and new areas must be developed to satisfy continued consumption growth.
Therefore, in order to meet global demand into the future, exploration of new areas and new well development MUST still exist. World oil prices in the range of $40-$45 per barrel is still less than the cost of Russian Arctic oil, European and Brazilian biofuels, US and Canadian shale and tight oil, Brazilian pre-salt oil production, and all production in the United Kingdom [7]. Sustained price levels below the cost of production can deter capital exploration and production expense. This will shift future production potential and ultimately reduce global supply. Additionally, state budgets for oil-producing countries suffer as oil prices dip below their respective fiscal breakeven prices. In December 2014, the world experienced this as oil prices fell below breakeven for almost all oil exporters [7]. Luckily, as oil consumption continues to recover from the global pandemic, supply and demand fundamentals will move back into balance to force the price of oil higher. Although some experts have predicted $150/bbl and $20/bbl crude swings may be in the near future, neither are sustainable price points. A rational price to support economic production while appeasing global consumption moving forward is likely found at prices above $55/bbl.
References
[1] https://www.cfr.org/content/newsletter/files/Breakeven_Oil_Summary.pdf
[2] http://graphics.wsj.com/oil-producers-break-even-prices/
[4] https://www.imf.org/en/Publications/WEO/Issues/2020/06/24/WEOUpdateJune2020
[5] https://knoema.com/infographics/vyronoe/cost-of-oil-production-by-country
[6] https://www.enverus.com/video/opec-and-non-opec-crude-production-webinar-replay-thank-you/
[7] https://knoema.com/infographics/vyronoe/cost-of-oil-production-by-country
[8] https://www.energyst.com/uk/news/capex-vs-opex/