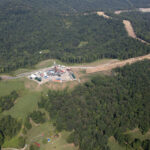
Penn Virginia (ticker: PVA) is an exploration and production oil and gas company based in Radnor, PA with district operating offices in Houston, Pittsburgh, and Tulsa. The company has a geographically diverse portfolio of oil, NGL and natural gas assets with producing and/or prospective properties located principally in East Texas, Oklahoma, south central Texas, southern Mississippi, and Appalachia.
PVA is rate-of-return driven when it comes to its investment decisions and prefers to grow organically through the drillbit. The company provided an operations update today on its Lavaca County, Texas drilling.
In this environment of relatively weak natural gas prices, investors are asking for a more rational approach to growth – one that generates economic returns and shareholder wealth, rather than a singular focus on growing production at the expense of economic returns. We believe PVA’s management team’s investment decision process and proven willingness to act on it, is aligned with shareholders’ interests.
We find the systematic process of building an oil and gas company through a highly selective process (i.e., targeting regions with proven and active hydrocarbon systems, acquiring an acreage inventory with multi-zone opportunities, with low-risk PUDs, and targeted zones that will benefit from horizontal drilling and completion technologies), a tactical process that establishes a foundation for predictable, profitable, future growth.
One methodology to see how a company is growing its reserves and production is the metric Debt-Adjusted Growth Per Share. We like this metric because it is a shareholder focused metric. It provides the shareholder with an idea of how a company is using all forms of capital (debt and equity, with the debt converted into equity) to grow reserves and production on a percentage basis. For the period of 2009 – 2011, PVA increased reserves on a debt-adjusted basis, 91% and increased production on a debt-adjusted basis 119%.
[sam_ad id=”32″ codes=”true”]
This metric does not say that PVA is or is not over-levered. At June 1, 2012, the company’s Debt-to-Market-Capitalization ratio was 305%. The company notes in its June 5, 2012 presentation that it has no major borrowing maturities until 2016, the 2012 capital expenditure program of $300MM to $325MM, while it will exceed 2012’s cash flow, is fully funded. We believe the company’s leverage ratio and the market’s perception that PVA is a natural gas company impedes the company’s trading valuation.
On June 1, 2012, PVA’s forward price-to-cash-flow multiple was 1.3 times. Using an Enterprise Value-to-Flowing-Unit-of-Production metric (enterprise value divided by trailing twelve month production per day) the market values the company at $7,689 per flowing Mcfe. This is 62% below the median rate of $12,380 of the 89 U.S.-centric companies in EnerCom’s E&P database.
Using the recent data provided in Penn Virginia’s news release, Oil & Gas 360® compiled a sum-of-the-parts valuation of the company’s primary assets – Eagle Ford, East Texas, Mississippi and Appalachia – and adjusted for PVA’s balance sheet.
We calculated a Base Case and Market Case “sum-of-the- parts” NAV for PVA. In the Base Case, using $1.00/MMBtu and $6.00/ barrel for proved reserves, we estimated PVA’s NAV at $11.58/share. Our assumptions are conservative as we are valuing all “resources” in the company’s inventory at $1.00/Mcfe. As for the company’s Eagle Ford and Marcellus shale acreage, we conservatively assigned a $5,000 and $2,555 value for the acreage, respectively.
In the Market Case, we use the same logic, but use $2.70/MMBtu for natural gas and $16.23/barrel for proved reserves to arrive at an NAV of $41.23/share. The difference in the two methodologies is in the Market Case we assign the median price per Mcfe value for Enterprise Value to 2011 Reserves, (the latest data available in company filings) in PVA’s 20-company peer universe to PVA’s proved reserves.
Peer group includes: AREX, CHK, COG, CRK, CRZO, DVN, END, EQT, FST, GDP, GEOI, GMXR, GST, HK, PETD, QEP, ROSE, RRC, UNT and XEC.


