Rare Petro
Oil & Gas Publishers Note: This is an outstanding case study from Kevin Olson at Rare Petro. He does a great job covering the global oil demand inflection points.
Abstract
The dual black swan events of 2020 have thrown supply and demand far out of equilibrium but with China purchasing crude again and various parts of the United States starting to open back up, global oil demand is beginning to return. As the world begins to recover to pre-pandemic levels, market forces will support the shift back towards equilibrium just like the shift we are currently seeing in China.
Introduction
With China purchasing crude again and various parts of the United States starting to open back up, global oil demand is beginning to return. While many estimates from the U.S. Energy Information Administration’s (EIA) Short-Term Energy Outlook remain subject to heightened levels of uncertainty because of the effects on energy markets due to mitigation efforts related to the coronavirus pandemic, the future seems bright. In fact, the EIA expects Brent crude oil prices will average $34 per barrel in 2020 and $48 per barrel in 2021 [1].
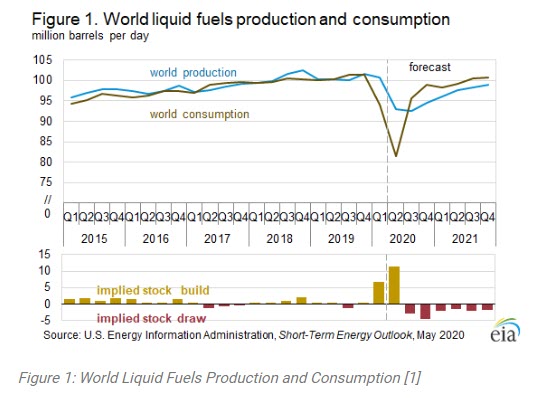
Despite crude oil prices remaining at some of their lowest levels in more than 20 years, the EIA expects that global liquid fuels inventories will grow by an average of 2.6 million barrels per day (MMBPD) in 2020 after falling by about 0.2 MMBPD in 2019 due to demand destruction from lockdown orders and low economic activity outpacing supply curtailments [1]. The EIA has postulated that global inventory builds will be largest in the first half of 2020, rising at a rate of 6.6 MMBPD in the first quarter and increasing to builds of 11.5 MMBPD in the second quarter because of widespread travel limitations and sharp reductions in economic activity [1]. Luckily, after the first half of 2020, global consumption is expected to increase leading to inventory draws for at least six consecutive quarters as seen in Figure 1, putting upward pressure on crude oil prices.
[contextly_sidebar id=”wKYx5OPjqpkHYrwSHBrzIVzo2hpxQAGG”]
Chinese Case Study
As the epicenter of the pandemic, it is logical that China was first to shut down due to the coronavirus and is now the first to begin returning to pre-COVID normality. Data published by a Reuters report indicates China is buying crude oil and their economy is running again. Chinese crude oil imports increased in April to ~9.84 MMBPD as demand for fuels began to rebound [4]. The country’s overall imports posted an improvement from March, at 3.5 percent, despite analyst expectations that they would slump by as much as 15.7 percent, but still well below the 10.64 MMBPD in imports seen in April 2019 [4]. This strongly suggests that a recovery is underway, and it may accelerate in the coming months as restrictions continue to be lifted.

Recent data published by Bloomberg uncovers Chinese fuel demand has surged in the past few weeks forcing run rates at Chinese refineries to spike to 10-year highs the week of May 11 as seen in Figure 2. While a majority of fuel consumption is returning due to increased commuting levels (people referring their own vehicles to public transportation) and business beginning to reopen, demand has not quite returned to pre-pandemic levels as airline travel is still significantly lower than it was a year ago. During the coronavirus pandemic, Goldman Sachs experts predict that oil demand in China was down 25% at its peak and is now only down 5% [6]. Estimates suggest the United States followed almost the exact same pattern of demand declines due to lockdowns on the way down so it would make sense it should mimic a similar trend on the way up. In other words, China’s crash in oil demand has bottomed out and is now beginning to recover with the U.S. following suit a few months later.
Current U.S. Oil Demand
As with everywhere else in the world, the coronavirus pandemic has decimated domestic oil demand due to reduced travel and economic activity. Analysts expect significantly lower levels of liquid fuels consumption during much of 2020. This is a direct result of the disruptions to economic and business activity because strict containment measures related to COVID-19 have dramatically reduced all forms of travel. Unfortunately, it does not matter how cheap oil is if people are not driving, flying, or consuming anything aside from the bare essentials – there is no demand boost from low prices.
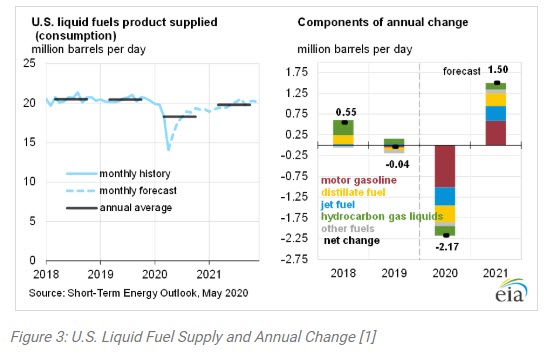
In December just before the coronavirus pandemic, the United States was consuming 20.31 million barrels of oil per day but by April, that number had dropped to just 14.08 MMBPD, a 30.67% reduction in just four months [3]. While this was a dramatic drop in domestic demand, experts predict much of those losses will return in the next few months as some business activity resumes and stay-at-home orders gradually ease (Figure 3). In fact, the EIA expects U.S. total liquid fuel consumption will rise from an average of 15.9 MMBPD in Q2 2020 to 18.7 MMBPD in Q3 2020 and average 19.8 MMBPD in 2021, up 8% from 2020 but below 2019 levels [3].
The pandemic in China began about three months before the United States, so the low point in crude demand for China was in February while the U.S. saw the biggest demand destruction in April. Some analysts predict Chinese oil demand is now just 5% lower than it was from pre-pandemic levels. This is in-line with the EIA prediction of a similar 7% decrease expected to be experienced stateside in a few months.
Unfortunately, oil demand data comes with a significant lag. As a result, traders rely on representative estimates for a more up to date view on the data. One of these representations is highway traffic and another is the amount of gasoline and diesel that’s trucked out from pipeline terminals into fuel stations [7]. In the U.S., the amount of gasoline supplied to the market increased the first week of May to nearly 5.9 million barrels a day. This is up from 5.1 million in the first week of April, but well below the typical 9 million barrels per day supplied before the virus, according to official data [7]. Early last month, refiners saw gasoline demand at 55% of normal level, which improved to 64% in the latest seven-day average [7]. This improvement in refined crude data indicates that consumption decline has bottomed out and the United States is on the path to recovery.
Current U.S. Oil Supply
 While the government cannot order companies to shut a valve to slow the national production like other countries, the dual black swan events of 2020 have forced many independent producers to voluntarily shut-in production due to historically low prices. Even with dramatically reduced production, oil prices have been slow to recover and production for most U.S. operators is still uneconomic. After hitting historic peak production of 13.1 MMBPD the week of March 13, volumes have plummeted a mere two months later to 11.6 MMBPD during the week of May 8. This is an 11.45% drop in 60 days. Initially it took U.S. producers 16 months to build from 11.6 to 13.1 MMBPD without supply constraints and before the pandemic decimated the global oil industry [2]. Taking this into consideration, it will take a very long time for domestic supply to return to pre-pandemic levels (if they even return to pre-pandemic highs).
Unfortunately, there does not appear to be an end in sight as experts predict total production of liquid fuels in the United States to fall by 0.8 MMBPD in 2020 (largely as a result of reductions in drilling price-sensitive tight oil regions) and to fall an additional 0.6 MMBPD in 2021 [1]. While the steepest declines will be in the current second quarter of 2020 (Figure 5), production will continue to decline at a slower rate through March 2021. At that time, analysts predict domestic production will bottom out at 10.7 mbpd, the lowest it has been since May of 2018 [2]. Production from March through December 2021 points to a modest rise as seen in Figures 4 and 5 in response to increased crude oil prices. Declines in domestic crude production outlasting the demand losses that will bounce back in a few months will result in the United States again importing more crude oil than it exports in the third quarter 2020. According to EIA forecasts, the U.S. will remain a net importer in most months through the end of December 2021 [2].
Global Oil Demand
Gradual relaxation of lockdown orders is supporting increased global oil demand. Although significantly reduced from previous years, experts predict global demand will return to near pre-pandemic levels in the ensuing months. This will occur as the number of people living under some form of confinement drops. With business starting to re-open gradually, people returning to work, and economies beginning to restart, a boost to global demand is inevitable; albeit a modest one at first. Before the pandemic, global oil demand was estimated to be 102.03 MMBPD and by April had dropped to a remarkable 76.34 MMBPD [3]. Estimates for May show a modest recovery to nearly 80 MMBPD while June predictions are topping out at 88 MMBPD [3].

The EIA estimates that global petroleum and liquid fuels consumption averaged 94.1 million barrels per day in the first quarter of 2020, a decline of 5.8 MMBPD from the same period in 2019, and expect demand will average 92.6 MMBPD in all of 2020, a decrease of 9.3 MMBPD year-over-year [3]. Demand should increase by 7.0 MMBPD in 2021 to settle around 99 MMBPD as seen in Figure 6 [3]. Furthermore, Goldman Sachs predicts 2-3 million barrels a day of demand from air travel will be lost, and a full recovery won’t take place before the third quarter of 2022 due to low business travel [6]. Lower global oil demand growth for 2020 in the May Short Term Energy Outlook reflects growing evidence of disruptions to global economic activity along with reduced expected travel globally as a result of restrictions related to COVID-19. Unfortunately, any lasting behavioral changes to patterns of transportation and other forms of oil consumption once COVID-19 mitigation efforts end present considerable uncertainty to the increase in consumption of liquid fuels.
Global Oil Supply
Oil production is not like a sink where you can simply turn off the faucet when there is too much water flowing into the bowl. It takes time for operators to choose to shut in production and then actually bring the production offline. This is why supply from members outside the OPEC+ group only saw production declines of 3 MMBPD in April from the start of the year [5]. Even though the global industry knew the market was horribly oversupplied by upwards of 30 MMBPD, decisions had to be made on when and how to bring production offline. May has brought the start of the spectacular OPEC+ agreement where member nations agreed to curtail 9.7 MMBPD from the market and is largely the reason why global oil supply is set to fall by an astounding 12 MMBPD to a nine-year low of 88 MMBPD [5].

It is on the supply side where market forces have demonstrated their power and shown how the pain of lower prices is affecting all producers. This was seen with the recent attitude change in the new OPEC+ agreement where a price war started in April but production was reversed in May to aid in an estimated 12MMBPD global production cut. Saudi Arabia recently announced it will reinforce the agreement by voluntarily cutting production by an additional 1 MMBPD for the month of June, and the UAE and Kuwait have followed suit with extra cuts of their own. This means Saudi production in June will be an extraordinary 4.4 MMBPD below April’s record high levels [5]. By year-end, however, it will be the United States that is the biggest contributor to global supply reductions compared to a year ago. U.S. production has the potential to be 2.8 MMBPD lower than at the end of 2019 [2]. For Saudi Arabia, the fall will only be 0.9 MMBPD assuming 100% compliance with the OPEC+ deal. The smaller reduction is due to incredible jumps in production at the start of 2020 [5]. Overall, experts predict OPEC production will begin to increase in July 2020 in response to rising global oil demand and prices, but supply from non-OPEC producers will decline by 2.4 MMBPD in 2020 compared to 2019 [2]. With this additional crude off the market, significant draw downs in overwhelmed global storage facilities will bring supply, demand, and ultimately prices, back into balance.
Conclusion
Just like the trend seen in the United States, globally an inflection point exists where the worst level for oil demand destruction has occurred but oversupply is still happening. With China purchasing crude again and various parts of the United States starting to open back up, global oil demand is beginning to return. It will still take time for supply to come back into equilibrium. Since global data on supply and demand are simply estimates, the United States can be utilized as a barometer for what will likely happen globally. As seen in the United States, demand is experiencing a L-shaped recovery. This means demand was quickly brought offline and now that it has bottomed out, is experiencing a slow recovery back to pre-pandemic levels. Supply reductions are expected to experience an extended L-shaped recovery when inventory levels eventually bottom out in the ensuing months. Once this equilibrium point is reached, the long road to recovery can begin. During this time, demand will outpace supply drawing down inventories and putting upward pressure on prices. Such a scenario will likely speed up the recovery at the global level as supply and demand fundamentals take over in post-pandemic crude markets.
China is the first mover in crude supply and demand coming back into balance. The United States is expected to be about a three month lag behind China, and then the World will recover as many other nations return to a new normal. The summary in Table 1 shows petroleum consumption, supply, and net withdrawals for China, the U.S., and the World from Q4 2019 through forecasted Q4 2020. During the majority of lockdown and stay-at-home orders, consumption decline was between 11% and 23% while supply remained relatively flat only growing by up to 2%. These imbalances appear to have been corrected when comparing the Q4 2019 data to Q4 2020 projection. Consumption is estimated to have grown by 2% in China and fallen by only 2% to 6% elsewhere while supply is falling between 1% to 12% year-over-year.

Oil production is reacting in a big way to market forces, and economic activity is beginning a gradual recovery. However, major uncertainties still remain. The biggest unknown is if governments can ease lockdown measures without sparking a resurgence of COVID-19 outbreaks. Can compliance with the OPEC+ agreement be achieved and maintained by all major parties? Will U.S. production ramp back up once prices reach a necessary threshold, and how much reservoir damage has been done from the shut-ins? These are big questions that will have major consequences for the oil market in the coming weeks.
References
[1] Short Term Energy Outlook, EIA, https://www.eia.gov/outlooks/steo/
[2] U.S. Weekly Supply Estimates, EIA, https://www.eia.gov/dnav/pet/pet_sum_sndw_dcus_nus_w.htm
[3] Petroleum Consumption & Sales, EIA, https://www.eia.gov/petroleum/data.php#consumption
[4] China’s Daily Crude Oil Imports Rebound in April as Fuel Demand Picks Up, Reuters, https://www.reuters.com/article/us-china-economy-trade-crude/chinas-daily-crude-oil-imports-rebound-in-april-as-fuel-demand-picks-up-idUSKBN22J0B6?rpc=401&
[5] Oil Market Report – May 2020, IEA, https://www.iea.org/reports/oil-market-report-may-2020
[7] Goldman Sachs says Global Oil Demand Will Bounce Back but Could Be Hit Hard by the Lack of Business Travel, Markets Insider, https://www.worldoil.com/news/2020/5/1/oil-demand-is-beginning-a-slow-and-fragile-recovery-worldwide
[8] Chinese Oil Demand is Almost Back to Pre-Virus Crisis Levels, Bloomberg News, https://www-bloomberg-com.cdn.ampproject.org/c/s/www.bloomberg.com/amp/news/articles/2020-05-18/chinese-oil-demand-is-almost-back-to-pre-virus-crisis-levels