Oil & Gas Publisher’s Note: This information from the EIA is not a trivial impact to the price of oil and natural gas. This is only one of the pricing and impacts that we had discussed 3 months ago with Bernadette Johnson, VP, Enverus. She had already taken these data points into consideration for the Enverus pricing models.
Electricity use in the United States is typically lowest in the spring and fall months, when demand for air conditioning and heating are often at their lowest levels. In each of the past 10 years, either April or October was the month with the lowest electricity demand, which reflects both sales from the grid and the electricity produced by net-metered systems, such as rooftop solar panels. Electricity demand generally increases as temperatures either become much colder or much warmer than about 55 degrees to 65 degrees Fahrenheit.
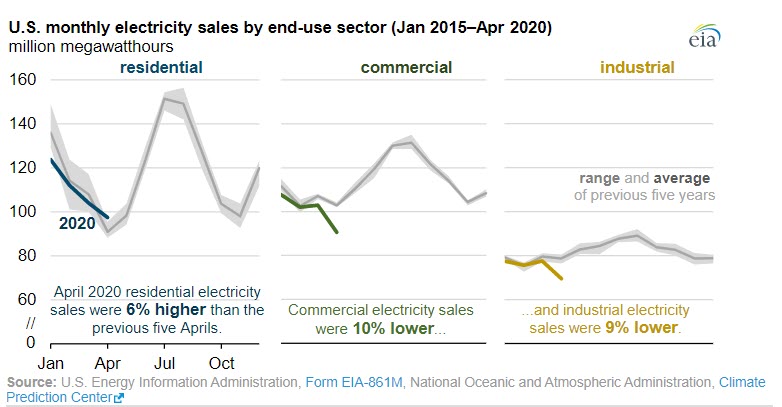
The residential sector is relatively sensitive to temperature changes. Based on the previous five Aprils, EIA estimates that the U.S. residential sector would have used about 3.1 million megawatthours (MWh) per day in April 2020. Actual residential electricity demand in April 2020 was 3.3 million MWh/day, or about 6% higher than the typical April value.
Across all sectors, April U.S. electricity sales declined 4% compared with last April, largely as a result of measures to reduce the spread of COVID-19. Starting with California on March 19, states began to issue stay-at-home orders in response to the pandemic. By mid-April, most states were under stay-at-home orders. As the orders took effect, businesses, schools, and industrial facilities closed, and office workers transitioned to working from home.

Electricity use in the United States is typically lowest in the spring and fall months, when demand for air conditioning and heating are often at their lowest levels. In each of the past 10 years, either April or October was the month with the lowest electricity demand, which reflects both sales from the grid and the electricity produced by net-metered systems, such as rooftop solar panels. Electricity demand generally increases as temperatures either become much colder or much warmer than about 55 degrees to 65 degrees Fahrenheit.
[contextly_sidebar id=”1I4hM45yjDDdAjhbS7MVLLKNwvsyW9II”]
The residential sector is relatively sensitive to temperature changes. Based on the previous five Aprils, EIA estimates that the U.S. residential sector would have used about 3.1 million megawatthours (MWh) per day in April 2020. Actual residential electricity demand in April 2020 was 3.3 million MWh/day, or about 6% higher than the typical April value.
The U.S. commercial and industrial sectors are relatively less temperature sensitive, but they still tend to use more electricity in the summer and less in the spring and fall. Based on the average of the previous five Aprils, daily commercial sector electricity demand is usually about 3.4 million MWh/day in April, and industrial electricity demand is about 2.6 million MWh/day. In April 2020, commercial electricity demand was about 10% lower than the typical April value, and industrial electricity demand was 9% lower.
Previous Today in Energy articles explain how electricity demand changed in certain areas of the country as stay-at-home orders were implemented, based on data in EIA’s Hourly Electric Grid Monitor. Two articles examined daily changes in New York state and the Midwest and Florida; another examined hourly changes in New York City.
Principal contributors: Alex Gorski, Greg Lawson