Thursday, August 27, 2026

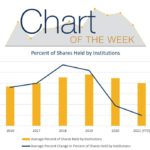
Chart of the Week: Retail vs. Institutional Investors in Energy

By Andrew Nichols: EnerCom Traditionally, individuals make their investments by hiring a professional organization to manage their money in the market and make decisions on their behalf. Institutional investing is not the only way to buy into the market though. Recently, there has been an increase in retail investors, who are non-professional investors that buy and sell securities on their
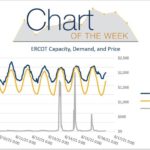
Chart of the Week: Power Supply and Demand Amid Texas Heat Wave

By Andrew Nichols: EnerCom The Electric Reliability Council of Texas (ERCOT) is an independent system operator that manages the flow of electric power to Texans and represents about 90 percent of the state’s electric load. Over the past couple of days, a large heat wave caused demand to nearly reach capacity in the afternoons when it is hottest. The heatwave

Chart of the Week: Crude Demand Returning Post COVID-19

By Andrew Nichols: EnerCom Over the past decade the United States shifted the trends in crude oil imports and exports. U.S. oil imports peaked at almost 11 million barrels of oil a day in late 2006. Since then, crude oil imports declined over the years and are at about 6 million barrels a day as of the end of May

Chart of the Week: Crude Demand Returning Post COVID-19

By Andrew Nichols: EnerCom Over the past decade the United States shifted the trends in crude oil imports and exports. U.S. oil imports peaked at almost 11 million barrels of oil a day in late 2006. Since then, crude oil imports declined over the years and are at about 6 million barrels a day as of the end of May

Chart of the Week: Gasoline Demand Post-Covid 19

By Andrew Nichols: EnerCom The Energy Information Administration (EIA) reports the number of miles traveled by vehicles which is a great indication of demand for hydrocarbons. On a monthly basis, the number of vehicle miles traveled increased in the first half of the year (January to June) and decreased during the second half of the year. Each year, vehicle miles

Chart of the Week: Gasoline Demand Post-Covid 19

The Energy Information Administration (EIA) reports the number of miles traveled by vehicles which is a great indication of demand for hydrocarbons. On a monthly basis, the number of vehicle miles traveled increased in the first half of the year (January to June) and decreased during the second half of the year. Each year, vehicle miles increased by an average

Chart of the Week: Gasoline Demand Post-Covid 19

The Energy Information Administration (EIA) reports the number of miles traveled by vehicles which is a great indication of demand for hydrocarbons. On a monthly basis, the number of vehicle miles traveled increased in the first half of the year (January to June) and decreased during the second half of the year. Each year, vehicle miles increased by an average

Oil & Gas 360 Chart of the Week

Chart of the Week: U.S. Energy Use in 2014

Petroleum, NatGas, Coal & Nuclear Delivered 89% of U.S. Energy in 2014 U.S. Energy Use: in its September release of the second Quadrennial Technology Review (QTR), AN ASSESSMENT OF ENERGY TECHNOLOGIES AND RESEARCH OPPORTUNITIES, the U.S. Department of Energy delivers 505 pages of research findings and itemizes where the federal government sees opportunities existing for new research to develop energy technologies.