EIA
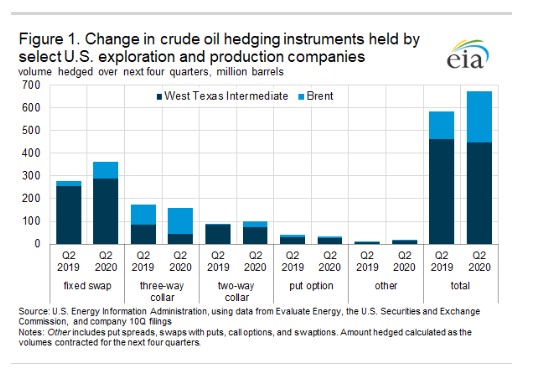
According to the U.S. Energy Information Administration’s (EIA) analysis of financial disclosures from 77 publicly traded U.S. crude oil producers, financial hedging activity in the second quarter (Q2) of 2020 increased year on year from the second quarter of 2019. As of their second quarter filings, these 77 companies entered into hedging contracts covering 673 million barrels of crude oil for the next four quarters, compared with the 583 million barrels of coverage provided during the same time last year (Figure 1). These companies collectively accounted for 3.9 million barrels per day (b/d), or 36% of total U.S. crude oil production, in Q2 2020. Crude oil producers enter into hedging contracts to lock in a specific price or range of possible prices that they will receive when selling their oil production in the future, thereby minimizing exposure to changing prices and increasing the stability and predictability of revenues. If these companies produce at the same levels they averaged during Q2 2020, these hedges would cover 47% of production during the following year, up from 41% during the equivalent period in Q2 2019.
EIA collected this information using quarterly financial reports of 77 publicly traded U.S. oil companies that hedged production during at least one quarter between Q2 2019 and Q2 2021. Consequently, the observations do not necessarily represent the sector as a whole because the analysis excludes private companies that do not publish financial reports and publicly traded companies with significant foreign operations. A list of these 77 companies is available on our website.
Although financial derivatives come in many forms, the majority of companies in this analysis relied on three principal types for hedging their oil production:
- Fixed swaps, a highly customizable instrument in which a producer agrees to receive a fixed, locked-in oil price in the future while their counterparty receives the future variable, market-determined price;
- Two-way collars, a firm purchases a put option giving it the right to sell crude oil at a specific price in the future while simultaneously selling a call option, which gives the option purchaser the right to buy crude oil at a specific price in the future, effectively placing a respective minimum and maximum on the price the oil company receives and typically reducing or eliminating the cost of the hedge; and
- Three-way collars, a variant of two-way collars, but the producer sells an additional put option that sets a further subfloor price, allowing a producer to potentially earn revenue on the hedging operation or purchase a more expensive put that is closer to current prices, albeit at the risk of losing money if prices drop below the subfloor price.
According to EIA’s analysis, the selected companies saw their collective use of fixed swap instruments grow from 276 million barrels over the next four quarters in Q2 2019 to 362 million barrels over the next four quarters in Q2 2020, and their relative share of hedged production increase from 47% to 54% during the same period. The use of two-way collars also increased during this period. Hedged volumes with this type of instrument grew from 86 million barrels to 99 million barrels, and two-way collars’ share of hedged production remained unchanged at 15%. The use of three-way collars, however, decreased year on year, falling from 173 million barrels to 158 million barrels, and their share of hedged production fell from 30% to 24% during the same period.
Although the exact logic behind the shift in hedging programs away from three-way collars and toward swaps and two-way collars varies by company, it could reflect a more conservative approach to cash flow management by oil producers. Three-way collars do not fully insulate producers from large price declines, whereas fixed price swaps and two-way collars guarantee a minimum future price outcome.
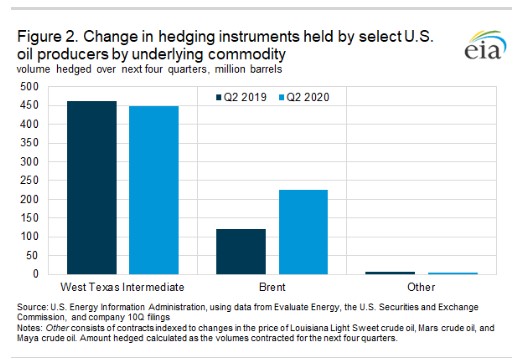
The rise of hedging instruments linked to Brent crude oil prices indicates another shift. Instruments linked to West Texas Intermediate (WTI) prices remain the most frequently used hedges by these public U.S. companies. Producers hedged 448 million barrels of production with WTI-linked derivatives over the next four quarters in Q2 2020 (67% of the total amount hedged). But this volume was 14 million barrels less than the amount hedged during the equivalent period in Q2 2019. Conversely, Brent-linked hedged volumes grew from 121 million barrels to 225 million barrels during the same period, and their share of total hedged volumes grew from 21% to 33%. Although there are several possible drivers of this growth, the increased use of Brent-linked derivatives is likely driven at least in part by the increasingly large volumes of crude oil that are exported from the United States—exports that are typically priced relative to Brent, unlike domestically sold volumes that are typically priced relative to WTI (Figure 2).
In addition to aggregate-level measures, increased hedging activity can also be observed in company-specific metrics. For instance, the average amount hedged over the next four quarters by the selected 77 companies increased from 8.5 million barrels in Q2 2019 to 10.4 million in Q2 2020, despite their collective production remaining, for the most part, flat during the same period. Similarly, most companies increased the share of their production covered by hedges. The average share that the 77 companies covered by this analysis hedged increased from 55% in Q2 2019 to 61% in Q2 2020. Increased hedging activity was particularly concentrated among companies hedging relatively high shares of their production. For instance, although only 24 of the selected companies (representing 19% of the selected companies’ collective production) hedged more than 60% of their individual production in Q2 2019, by Q2 2020, 32 of the selected companies (representing 39% of collective production) hedged more than 60% of their production (Figure 3).

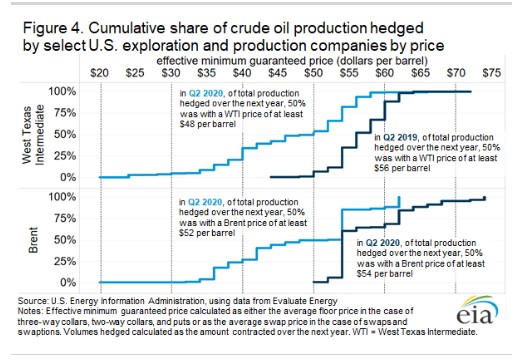
Falling oil prices have also changed the price at which the selected 77 companies are hedged. According to EIA’s analysis, 50% of the companies’ WTI hedges over the next four quarters were hedged with a price of at least $48 per barrel (b) in Q2 2020, down from $56/b during the equivalent period in Q2 2019. Brent price hedges also fell, declining from $54/b to $52/b during the same period (Figure 4). By comparison, as of September 25, the average price of crude oil futures for delivery between Q4 2020 and Q2 2021 stood at $41.05/b for WTI and $43.13/b for Brent, making these hedged prices higher than recent futures market prices.
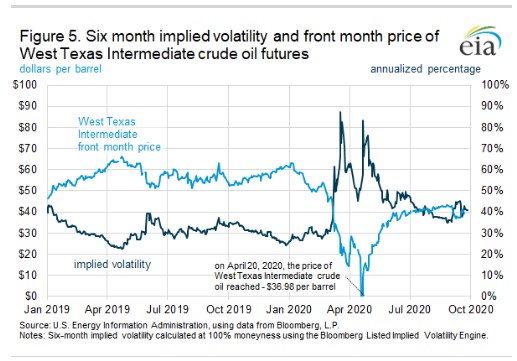
Hedging crude oil production through financial derivatives typically requires that firms pay a counterparty a premium to compensate for the additional risk incurred. Although the price of this premium varies—depending on the kind of derivative, the underlying asset, the extent of the risk transferred, the duration of the hedge, and prevailing liquidity conditions—hedging is generally more expensive for crude oil producers when implied volatility is high, and it is less expensive when implied volatility is low. Given that the six-month implied volatility for WTI crude oil futures increased from an average of 29% in Q2 2019 to 53% in Q2 2020, hedging future production in 2020 is therefore likely to be more expensive for crude oil producers than it was in 2019 (Figure 5).
U.S. average regular gasoline price increases, diesel price decreases
The U.S. average regular gasoline retail price increased less than 1 cent, remaining virtually unchanged at $2.17 per gallon on September 28, 47 cents lower than the same time last year. The Midwest price increased nearly 3 cents to $2.06 per gallon. The West Coast and Rocky Mountain prices each decreased by nearly 2 cents to $2.82 per gallon and $2.30 per gallon, respectively, the East Coast price decreased nearly 1 cent, remaining virtually unchanged at $2.11 per gallon, and the Gulf Coast price decreased less than 1 cent, remaining virtually unchanged at $1.84 per gallon.
The U.S. average diesel fuel price decreased 1 cent from the previous week to $2.39 per gallon on September 28, 67 cents lower than a year ago. The East Coast, West Coast, and Rocky Mountain prices each decreased more than 1 cent to $2.47 per gallon, $2.93 per gallon, and $2.34 per gallon, respectively, and the Gulf Coast price decreased less than 1 cent to $2.15 per gallon.
Propane/propylene inventories rise
U.S. propane/propylene stocks increased by 4.1 million barrels last week to 102.0 million barrels as of September 25, 2020, 13.4 million barrels (15.1%) greater than the five-year (2015-19) average inventory levels for this same time of year. Gulf Coast, Midwest, and East Coast inventories increased by 3.7 million barrels, 0.4 million barrels, and 0.1 million barrels, respectively. Rocky Mountain/West Coast inventories decreased by 0.1 million barrels.
