EIA’s most recent issue of Natural Gas Monthly contains extensive revisions to data for 2016, 2017, and year-to-date 2018 because of benchmarking to annual data published in the Natural Gas Annual 2017 (NGA).
In July 2018, for the 15th consecutive month, dry natural gas production increased year to year for the same month a year ago. The preliminary level for dry natural gas production in July 2018 was 2,586 billion cubic feet (Bcf), or 83.4 Bcf/d. This level was 8.7 Bcf/d (11.6%) higher than the July 2017 level of 74.7 Bcf/d.
The average daily rate of dry natural gas production for July was the highest for any month since EIA began tracking monthly dry production in 1973.
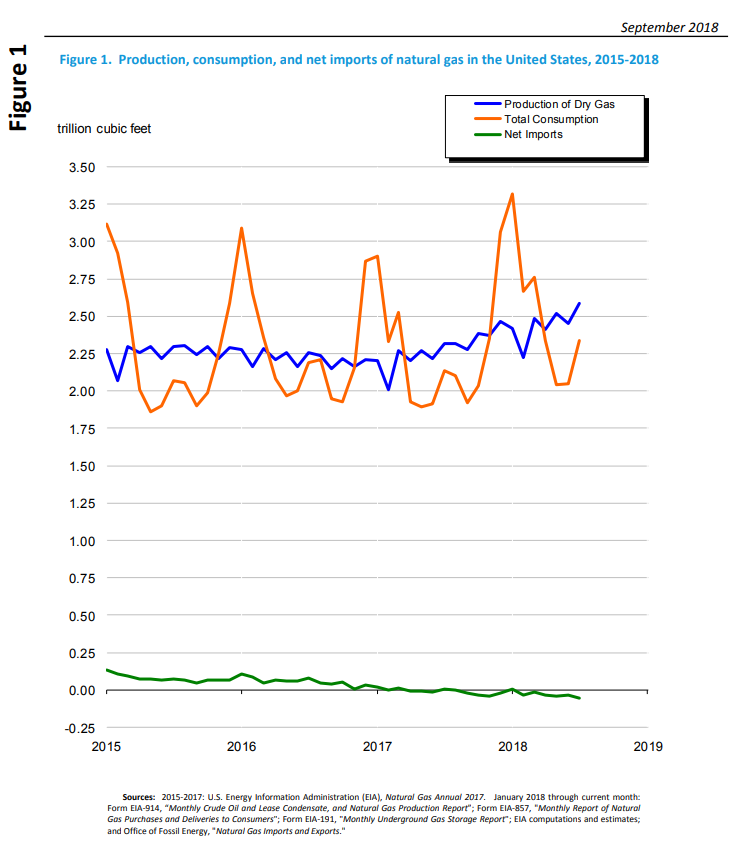 The estimated natural gas consumption level in July 2018 was 2,336 Bcf, or 75.4 Bcf/d. This level was 9.5% (6.5 Bcf/d) higher than the 2,133 Bcf consumed in July 2017. Natural gas consumption for July was the highest level for the month since 2001, when EIA began using the current definitions for consuming sectors.
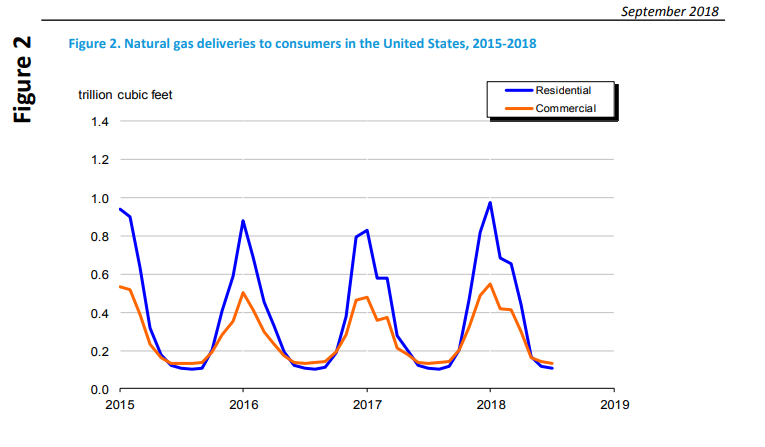
Year-over-year total consumption of dry natural gas in July 2018 increased in three of the four consuming sectors. Deliveries of natural gas by consuming sector in July 2018 were:
-
- Residential deliveries: 105 Bcf, or 3.4 Bcf/d, down 1.9% from 3.5 Bcf/d in July 2017. Residential deliveries were the lowest for the month since EIA began tracking residential deliveries in 1973.
- Commercial deliveries: 135 Bcf, or 4.4 Bcf/d, up 0.7% from 4.3 Bcf/d in July 2017. Commercial deliveries were the highest for the month since 2014
-
- Industrial deliveries: 652 Bcf, or 21.0 Bcf/d, up 4.5% from 20.1 Bcf/d in July 2017. Industrial deliveries were the highest for the month since EIA began using the current definitions for consuming sectors in 2001. July was the 15th month in a row that industrial deliveries set a new high for the given month.
- Electric power deliveries: 1,229 Bcf, or 39.6 Bcf/d, up 14.4% from 34.6 Bcf/d in July 2017. Electric power deliveries were the highest for any month since 2001, when EIA began using the current definitions for consuming sectors

Net natural gas imports (imports minus exports) were minus 54 Bcf, or minus 1.7 Bcf/d, in July 2018, making the United States a net exporter. Total imports were 8.0 Bcf/d, a decrease of 0.8% from the 8.1 Bcf/din July 2017.
July LNG exports beat last year by 81%
Total exports were 9.8 Bcf/d, an increase of 22.2% from the 8.0 Bcf/d in July 2017. The increase in exports continues to be driven by liquefied natural gas (LNG). LNG exports in July 2018 were 81.5% higher than in July 2017. In July 2018, the United States exported 3.2 Bcf/d of LNG to 14 countries.