The Growth of the Marcellus
The growth of drilling, acquisition, and production in the Marcellus has been fast and furious since gaining the notoriety as one of the planet’s premier natural gas plays. Companies with natural gas exploration experience flocked to the area, gobbled up acreage positions and continued to improve techniques to drive increased production in the region.
Production in the Marcellus has grown from 1,144 MMcf/d in January 2007 to 16,293 MMcf/d in November 2015. Total U.S. dry natural gas production went from 50,850 Mcf/d to 74,232 Mcf/d over the same period which means the Marcellus has gone from accounting for 2.2% in 2007 of the total production to 21.9% in 2015.
The regions production has increased dramatically over the last five years, as evidenced in the chart below, with production growing eightfold from 1,044 Mcf/d in January 2010 to 8,796 Mcf/d by December 2015.
The rig count peaked in October 2011, and again in January 2012, clocking in at 141 rigs, with a production rate of 2,884 Mcf/d and 3,278 Mcf/d respectively. Since the January 2012 peak, rig count has steadily fallen. Increased efficiencies drove the rig count to fall to 96 rigs by August 2012, where it hovered between 80 and 100 until the end of 2014 when the oil and gas industry price structure began to collapse. However, production during that time managed to increase from 3,794 Mcf/d in August 2012 to 7,786 Mcf/d in 2014.
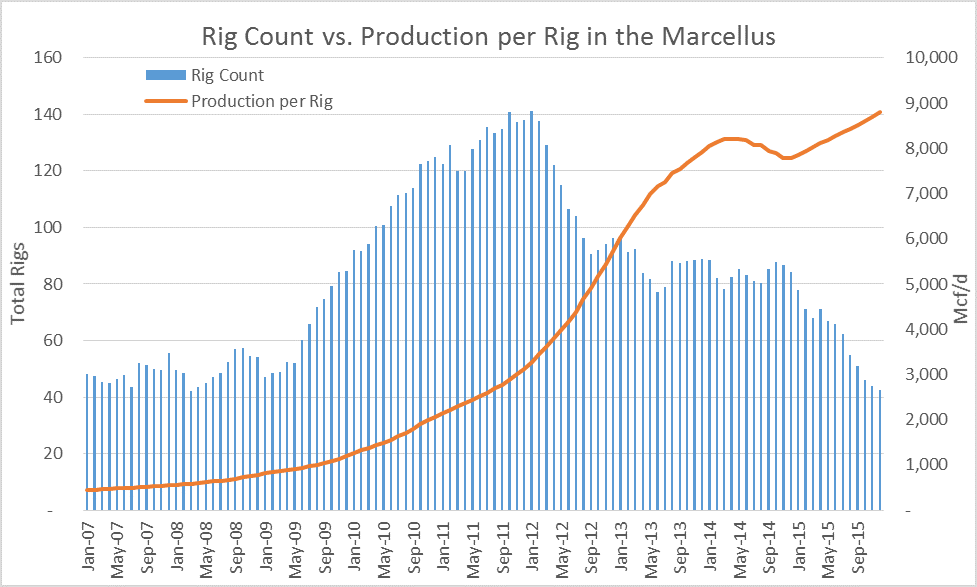
Source: Tudor, Pickering, Holt rig count, and EIA, compiled by EnerCom Analytics
Knowledge of the rock and continued efficiency improvements over the last eight years led to greater production from fewer rigs. Production continued to rise, despite the price of natural gas falling dramatically in the last year and a half. But sheer production numbers don’t tell the entire story. Profitability at $4.00 gas is a whole different animal than turning a profit at $2.00 gas.
But much more goes into the cost structure of oil and gas exploration than ‘put a few dollars in and get a few dollars out’. It costs cold hard cash to find and operate the well, and it costs more to pay the people and banks that are providing the manpower and the cash to run the ship. With multiple inputs going into a cost structure, there is more than one way to compress these costs and maintain a margin in a depressed price environment.
Costs and Margins
It goes without saying that the primary survival instinct of an E&P company in a depressed price environment is to cuts costs. The total cash cost associated with operating a well is among the most controllable factors. Companies can crunch these numbers through negotiating service contracts, layoffs, and restructuring debt.
A unit per unit breakdown of cash costs is listed below, based on information from Q4’15 quarterly reports and data compiled by EnerCom Analytics.
| Opex/Mcfe | G&A/Mcfe | Interest Expense/Mcfe | Total Cash Cost/Mcfe | |
| AR | $1.45 | $0.27 | $0.44 | $2.16 |
| COG | $0.98 | $0.09 | $0.16 | $1.24 |
| EQT | $0.62 | $0.19 | $0.23 | $1.05 |
| GPOR | $1.01 | $0.18 | $0.27 | $1.46 |
| RICE | $0.72 | $0.43 | $0.42 | $1.56 |
| RRC | $1.13 | $0.33 | $0.31 | $1.77 |
| SWN | $0.84 | $0.23 | $0.02 | $1.08 |
Source: EnerCom Analytics
Operating costs can vary dramatically from company to company based upon the service contracts in place, LOE, and transportation costs. Excluding the obvious outlier of Antero Resources, the spread between the other six companies ranges from $0.62 to $1.13 per Mcfe.
One of the major factors playing into this array is the cost of transporting and processing product. As a component of operating expense, EQT reported a $0.44/Mcfe cost for transportation and gathering, RRC had a $0.85/Mcfe cost, and AR had a $1.23/Mcfe cost. Before we say this component is solely responsible, EQT still has the lowest cost and AR still has the highest costs after stripping out transportation and gathering.
An assertion could be made that this speaks to the asset quality and the difficulty, or lack thereof, of extracting the gas from the ground. However, this stat also alludes to the infrastructure constraints in the Marcellus and how companies are paying substantial amounts to get their product to market.
Interest expenses also cut sharply into sale revenues, with the seven companies averaging a cost of about $0.26/Mcfe for the sole purpose of servicing its debt. That equates to nearly 14% of the sales price if the product were to be sold at the Henry Hub benchmark of $1.86/MMbtu as of 3/22/2016.
Cash Margins and the Hedge Game
The cash costs are significant only from the perspective of operating the wells, paying employees, and servicing debt. The last two components to add into the equation are derivatives and total oil and gas revenue. We use total oil and gas revenue due to the fact that not all companies are 100% natural gas producers, this will allow for factoring in NGL’s and oil production. The inclusion of realized derivatives is a factor in lifting the overall revenue of companies that hedged properly (and conversely for those who missed the boat).
| Oil and Gas Revenue/Mcfe | Realized Derivatives/
Mcfe |
Cash Costs/Mcfe | Cash Margin (no hedges)/ Mcfe | Cash Margin (with realized hedges)/Mcfe | |
| AR | $2.32 | $1.96 | $2.16 | $0.16 | $2.12 |
| COG | $1.74 | $0.40 | $1.24 | $0.50 | $0.90 |
| EQT | $1.42 | $0.65 | $1.05 | $0.37 | $1.02 |
| GPOR | $3.21 | $0.00 | $1.46 | $1.75 | $1.75 |
| RICE | $2.07 | $1.33 | $1.56 | $0.50 | $1.83 |
| RRC | $1.92 | $1.30 | $1.77 | $0.15 | $1.45 |
| SWN | $1.80 | $0.27 | $1.08 | $0.71 | $0.98 |
Source: EnerCom Analytics
This line of analysis shows that companies who have some of the higher cash costs are also the ones that have gained that allowance through their hedge program. Case in point, Antero Resources. Antero has among the lowest margins before factoring in their realized hedge results. After accounting for hedges, they have among the best cash margins.
Another point to this analysis is the oil and gas revenue, Antero has among the highest realized revenue per Mcfe. This is due in large part to the fact that they are not a 100% natural gas producer. Antero has exposure to more oil and NGL than several of the companies in the study who are focused more on natural gas. Antero’s reserves are 72% natural gas according to the EnerCom database, below the group average of 87% weighting to natural gas.
The chart below shows cash margins in Q4’13 when Henry Hub averaged $3.85/MMBtu.
| Oil and Gas Revenue/ Mcfe | Realized Derivatives/ Mcfe | Cash Costs /Mcfe | Cash Margin (no hedges)/ Mcfe | Cash Margin (with realized hedges)/ Mcfe | |
| AR | $4.39 | $2.63 | $2.40 | $1.99 | $4.62 |
| COG | $3.88 | $0.00 | $1.30 | $2.57 | $2.57 |
| EQT | $2.99 | $0.00 | $1.08 | $1.91 | $1.91 |
| GPOR | $7.43 | $0.00 | $1.49 | $5.94 | $5.94 |
| RICE | $1.48 | $0.09 | $1.61 | -$0.13 | -$0.04 |
| RRC | $4.82 | -$0.03 | $1.74 | $3.08 | $3.05 |
| SWN | $3.67 | $0.01 | $1.27 | $2.40 | $2.41 |
Source: EnerCom Analytics
The cash margins realized in Q4’13 were far higher than those the companies are seeing in Q3’15, and one would expect that with the dramatic change in commodity prices.
Looking forward to 2016 Range Resources’ investor presentation says, “Hedges of ~750 Mmbtu per day of production at ~$3.24 lock in a significant portion of 2016 cash flow.”
Even in a depressed price environment, these seven companies have been able to make the most of the situation by high grading assets, reducing overall cash costs, cashing in on in-the-money hedges, and making certain that NGL’s and oil make it to market as well.
We spoke to John Gerdes, Managing Director and Head of Research at KLR Group about his thoughts on why companies are still drilling in this environment. He said, “They probably shouldn’t be. That said, the 2016 programs that have been announced have been dramatically reduced from 2015 levels. Companies like Range, Antero and EQT have 50% or more of their 2016 volumes hedges so they can support the capital for a reduced drilling program.” Gerdes continued, “We are likely to see companies cut back even more if prices remain at current levels or deteriorate further. Companies should be focused on generating full-cycle returns and in the Marcellus, we think companies need about $3.25 gas prices to breakeven.”