The EIA’s Jeff Barron joined the EnerCom Dallas conference last week, both as an attendee and as a presenter. At lunch time Thursday he laid down a detailed, analytical presentation that spoke volumes to the analysts, institutional investment officers and the oil and gas management teams in the room.

Barron serves the U.S. Department of Energy’s Energy Information Administration (EIA) as an industry economist.
Working with the Office of Energy Markets and Financial Analysis, his work is focused on petroleum and petroleum products and the linkages between the physical and financial markets. Barron is a writer of the Monthly Markets Review for the EIA’s Short-Term Energy Outlook (STEO), and he is a contributor to the STEO price forecast. And he is a regular contributor to EIA’s This Week in Petroleum and its Today in Energy articles, writing analyses of quarterly and annual financial performances of global and U.S. companies.
Taking the audience through a highly detailed, data-driven presentation, Barron was essentially a living representation of the high level of skill and analytical ability within the EIA—the people who convert raw data into complex projections, forecasts and analyses that the energy industry, world governments, business media and the investment community rely heavily upon.
In the breakout session following his presentation, Barron pointed out that the EIA is the only U.S. government agency that is totally independent. The EIA’s ‘mission’ page says that by law, its data, analyses, and forecasts are independent of approval by any other officer or employee of the U.S. government. In other words, EIA collects, analyzes and publishes its data independently of anyone else in the U.S. government.
Through his presentation, Barron demonstrated how the EIA looks at data and how it generates its forecasts. Excerpts of his commentary appear below.
“I’m going to start with the most famous chart that EIA publishes, because as you know, we talked about it yesterday when the Dallas Fed came to present. This is our price outlook for WTI after 2019. Our expectation is for prices to come down slightly from current levels. I’ll go over into some of the reasons why we think that.

“We have here what we label the NYMEX confidence intervals. I’m not too personally comfortable with those terms because it presupposes a statistical process that we somehow are deriving when, in fact, we take implied volatility on the options that are trading in those months, and using the applied volatility to come up with sort of the uncertainty bands that are market-implied. So that’s really what those are, folks.”
“We saw some periods of significant oversupply in 2015 and 2016. 2017, on the contrary, was one of those years where we had some significant withdrawals from inventory, averaging about 250- to 500,000 barrels per day over those quarters.
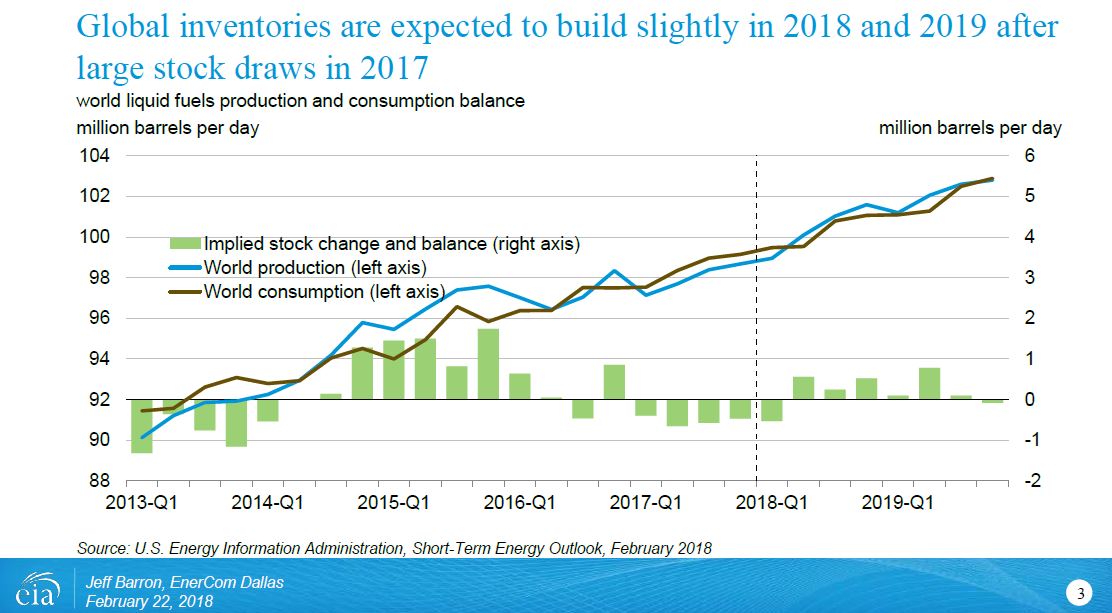
“And so far, it looks like Q1 of 2018 we’re experiencing a similar phenomenon. However, we do expect some inventory builds to begin over the course of the rest of 2018 and 2019 almost throughout the entire forecast period, also averaging about 250,000 barrels a day or so.
“The price is really important and it conveys a lot of information,” Barron said. “And we can look at prices in a very cursory sense and from a Bloomberg or Reuters or Financial Times-type perspective. But when you look at different price relationships, you can get a lot of information.
“The second thing is that rate of change is more important than level. … What you’ll notice is that the rate of change or the rate of decline in the total petroleum inventories for OECD countries basically at the largest rate over the past 15 years. So, it’s quite a large swing there, going almost 200 million barrels year-over-year decline.”
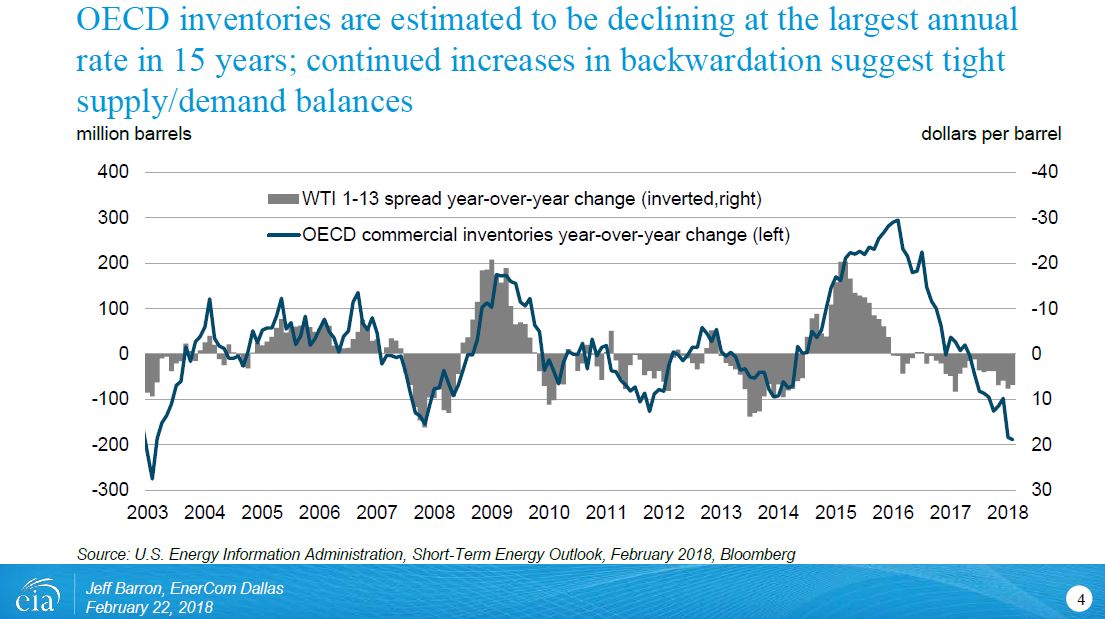
“We’re seeing the backwardation in the WTI futures curve, similar with the Brent futures curve, get significantly steeper than when we had been. But when you watch these developments in real time, it can suggest to you that inventories and global demand are drawing and global demand is strong.
“So, what we saw in beginning and latter half of 2017, we saw the shape of the futures curve – I’ll show you the actual raw shape at this get significantly more backwardated, suggesting that global demand was pulling stocks down. And the benefit of that, of course, is that OECD demand data is lagged by several months, so we don’t have that in real time like we do with prices. Non-OECD inventory data is more or less nonexistent, so it’s going to be tough get a sort of a global perspective.”
“Here’s OPEC’s favorite measure … We hear it in the press all the time. OPEC says, “We want to get OECD inventories down to the five-year average.” Well, by any sort of reasonable measure, we’re essentially there because our latest estimates through January here, show that we’re anywhere from 50 or so million barrels above the five-year average.
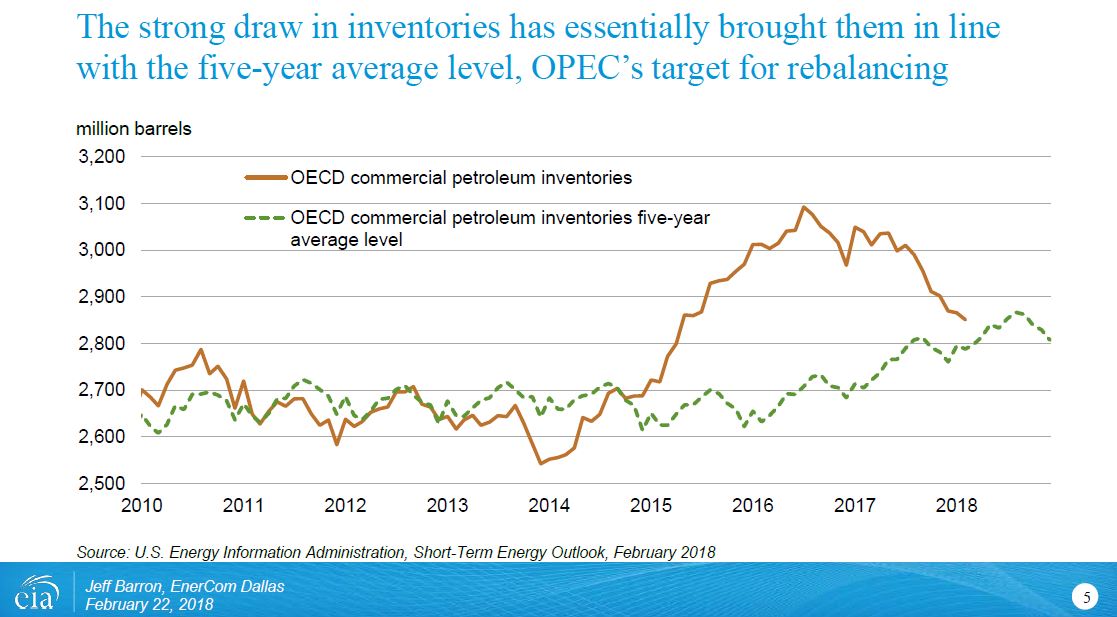
“One could argue that’s basically within a statistical noise level that we’re almost already at balance. And now they started talking about, “Well, let’s use a different measure. Let’s use days of forward demand.” I could have shown you the exact same chart, folks, and it will look pretty darned close; that we’ve gone from days of forward demand relative to the five-year average maybe within a day or a day or two above that.
“So again, by all reasonable measures, we’re more or less at the target that OPEC has achieved. It’ll be interesting to see going forward as they head into their next meeting what are they going to start talking up. Seeing that they’ve already started to try and talk up maybe even extending into 2019, but that’s a different story.”
Barron said looking at what’s going on in the United States, “I’m really focused on the change in the level of inventories. This is, again, crude and total products. It’s a five-year min/max range from our Weekly Petroleum Status Report of inventory builds above the zero line or draws below the zero line.
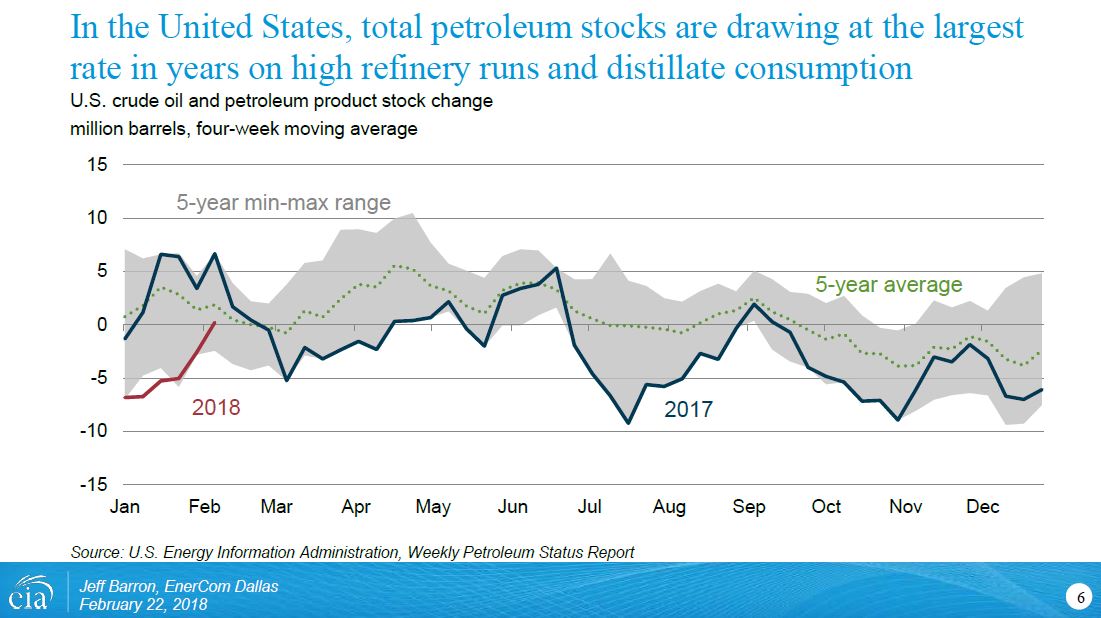
“We’ve seen very high refinery runs in the United States. I think for this time of year, we’re setting probably all-time highs. What used to be sort of a summer refinery rate, we’re now seeing that as capacity expansion has come online. Utilization was up over 90%, I think, until recently. So very, very strong refinery demand.
Barron said U.S. exports have been a game-changer.
“I don’t have an actual chart on that, but in this morning’s release we saw crude-oil exports at two million barrels per day, petroleum products at four million barrels per day. So if you think about it from a total petroleum perspective, we have high demand. Products supplied in the U.S.: 20 million barrels per day, exporting four million of products, exporting two million of crude.
“We’re in a 100-million-barrel-per-day world, so if you try and think about how one out of every five barrels is consumed in the United States, one of every 10 barrels is a gasoline – gallons of gasoline in United States car tanks. So, if you can get a read on what’s going on with U.S. demand, you get a pretty good picture with what’s going on with global demand.
“I spoke with several folks yesterday just about how our numbers are brought together. And if you’re looking at these things on a weekly basis, the things you want to keep in mind is that our import number is very good, our export number is very good because we can get those from not only customs; and we have advanced data from Homeland Security. The other thing to keep in mind is that the refinery runs and refinery stock levels, inventories – we survey about 90% of the operators that have that on a weekly basis. On the monthly, we get a census, we get everything. So those numbers are pretty rock solid on a weekly basis. The only number where it’s a lot more challenging is that weekly U.S. production number.
“We have good monthly estimates on total crude-oil production. It’s the weekly where we’re going to have to do some type of modeled estimate, but it’s usually within about a 1% error rate when you actually go back and compare the weeklies to the monthlies.”
The fear gauge – a big short squeeze
“We had a sort of a rare event recently. The brown line here is the VIX. That’s the fear gauge, whatever you want to call it, the equity volatility. And then the light blue here is the OVX, or oil-implied volatility.
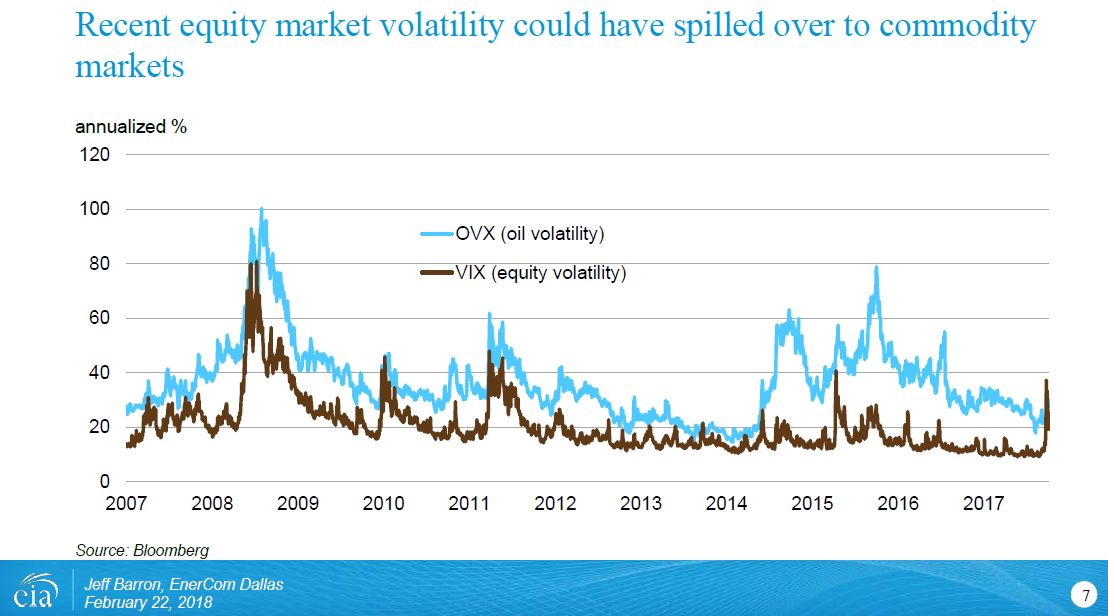
“And it’s pretty rare—a single commodity that’s probably one of the most volatile and inelastic goods in the world that you can probably think of compared to a basket of blue-chip stocks, 500 stocks, and their implied volatility.
“Well, it had a lot to do with certain folks that were structurally short volatility as part of their portfolios and using that, and that trade led to a big short squeeze. At least that’s my hypothesis, and that contributed to the increase in equity volatility and actually got above oil volatility for a couple of days. It’s the first time since Lehman collapsed that something like that happened.
“It’s hard to tell exactly what the spillover or if there will be any long-lasting effects. We know in 2016 there was a very high degree of correlation between crude-oil prices and equity prices. So far that hasn’t quite emerged despite this phenomenon, but it could be seen that that has led to a little bit of pullback in price.”
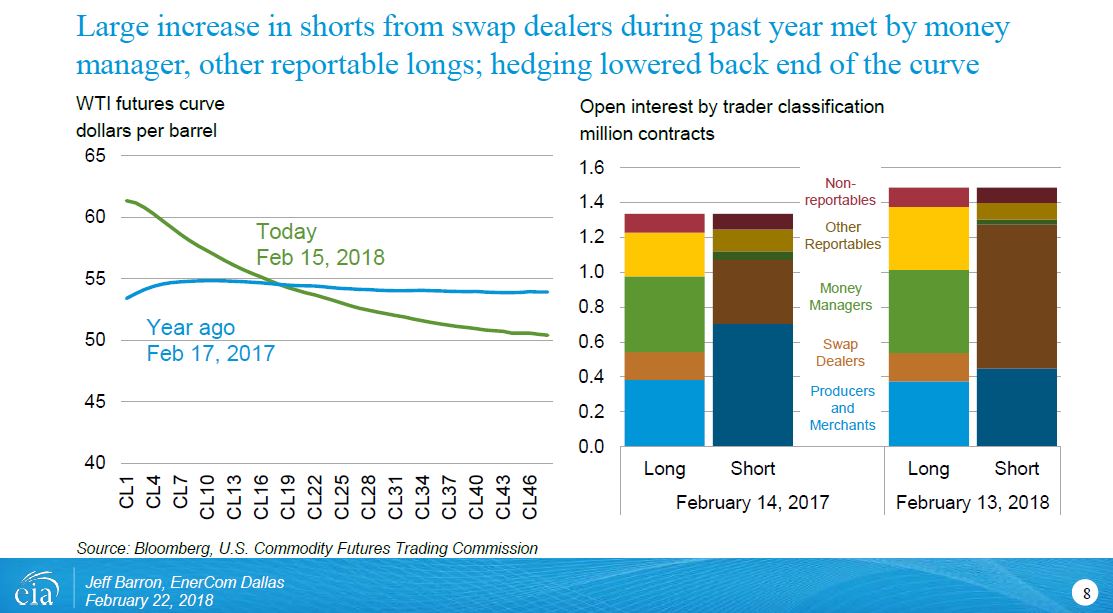
The futures curve
“A year ago, that’s that blue line in 2017, the futures curve had already shifted from 2016, a state of severe contango, which is reflective of very high storage costs and the inventories building at that point. And OPEC had just announced that they were going to be reducing production, and this is the implementation date of that. We saw a little bit of contango in the front part of the curve, more or less flat throughout.
“So, you compare last year, again, around the similar time period, to this year. What’s changed has been a pretty dramatic change in terms of who holds the long and shorts. Total open interest, excluding the spreading categories, gone up about 200,000 contracts.
“So what we’ve been seeing from the oil-company presentations, they’ve been increasing their hedging program. You see that with the swap dealer short positions, that tan, dark tan bar increased over the past year about 400,000 contracts. Well, that’s been met by the other side of the trade. Typically, money managers – that they increased about 100,000 or so contracts long, and other reportables. A very – not-so-transparent category in the CFTC’s definitions. A lot of hypotheses are that it’s maybe some prop trader, some algo-type people that manage their own money. They can get some fairly large positions. Regardless, they’ve increased about 50,000 contracts taking the other side of that trade.
Hedging
“So my hypothesis, and I think it was confirmed with a lot of the oil companies that have been speaking is that they have been more or less increasing their hedges over the course of the past year or year and a half or so. And hedging does exactly what it’s designed to do. It’s the opposite of that short VIX trade that I was talking about earlier. The short VIX trade is designed to make money for six years and then go to zero in a day, and that’s exactly what it did.
“Well, hedging is doing what it’s expected to do here, where it’s supposed to do cost you a little bit of money, like an insurance policy or insurance premium, and then pay off bigtime when prices collapse as we saw in the sort of darker tan line here, realized plus unrealized gain/loss on derivatives. This is for 58 U.S. E&Ps that I track. Got a big payoff there when prices collapsed.
You can’t change the wind, but you can adjust your sails
“So you can pay to be hedged and you’re limiting your exposure on the downside, but of course, you’re foregoing your upside. Your costs don’t have that luxury. Your costs are going to be tied to the oil price.
“This is the BLS producer price index. And they have the prices paid or prices received for various industries. You can look at it by drilling, support, frac sand. From a year-over-year basis – again, that’s the comparison compared to last year – the costs are up about 10% or so, which is significantly less than the prices. The prices have gone up 20-something percent or so.

“But when you compare it to $100 oil days, this is indexed. This particular chart is indexed to January 2014. You can see that at least with drilling and frac sand, still significantly lower depending what you’re looking at, 25%, 10 or 15%. And of course, each company is going to have differences. This is the aggregate BLS number.
“Glen in his introduction yesterday said, “Hey, will 2018 be the year of free cash flow?” I’m not too certain about that. You look at the cash flow per barrel of oil equivalent in the blue and the cap-ex for BOE in the tan, so far, the trend has been throughout the entire time period, throughout the downturn, to have free cash flow still be negative.

“But the question for maybe EIA’s purpose is not so much whether free cash flow is positive or negative. I think our interest is more looking at the raw cap-ex line itself, and is cap-ex going up or is it going to be going down? Because that investment is what drives the U.S. crude oil production forecast.”
“We all follow the rig counts every single week. In this particular case, I’m looking at the monthly change in active oil rigs on those gray bars on the left axis, and I shifted it forward five months. We all know that there is a lead-lag relationship among the variables price, rig count, and eventually oil production.
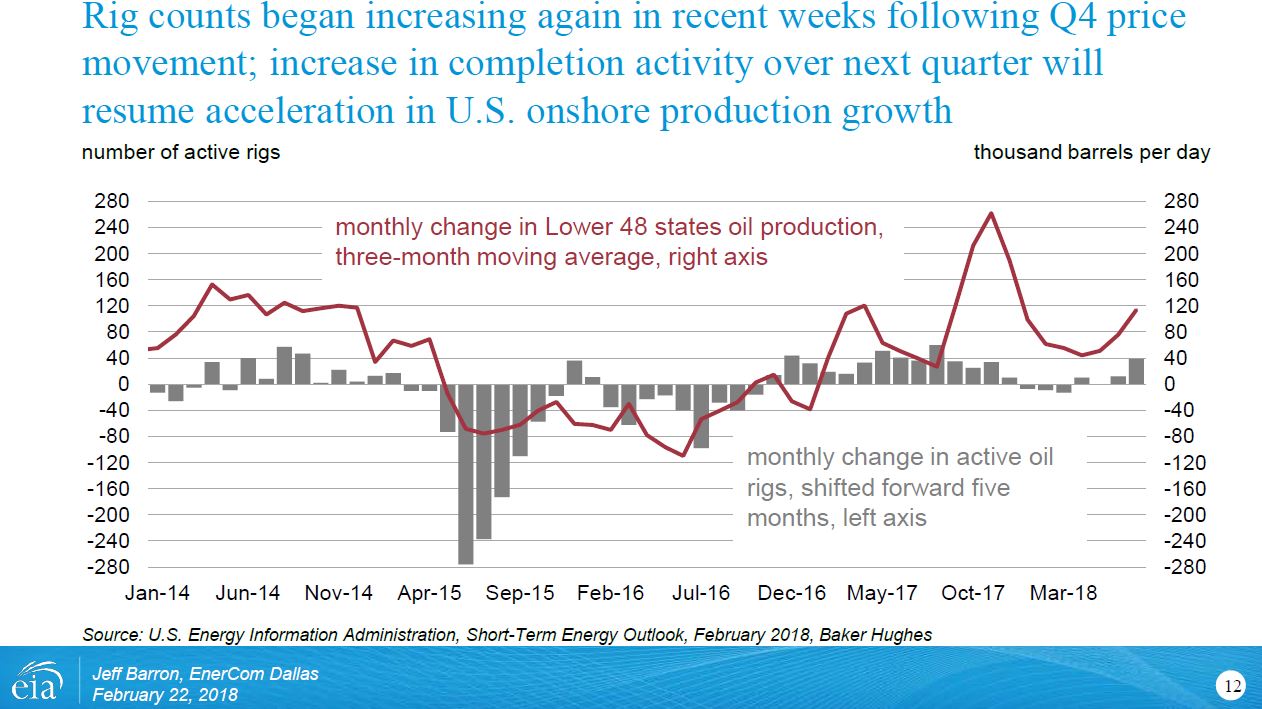
“It takes 12 or 13 weeks when you get a price change. Typically, feeds into additions of active oil rigs, and of course, four to six months – that time is starting to get lower and lower as we become more productive. But about four to six months to get some first oil.
“We saw that during the downturn, big, big decline in the rigs that we saw throughout several presentations already, bottomed out in’16. Saw some very large, significant increases in rigs throughout the course of 2016, so since it’s shifted forward five months, you can kind of see that by December of ’16 that’s when you would see the oil production start coming online.
“And lo and behold, that’s what that red line is. It’s the monthly change in oil production. So it’s been above zero this entire time, meaning the production has been growing, which is consistent with what we’ve been saying at EIA. But over the past year or so – I should say since maybe Q2 or Q3 of 2017 and even into Q4 – the rig count more or less leveled off, started to decline slightly.
“And what did that do to the oil production? Again, still above zero but it decelerated. The second derivative was negative at that point. And it’s really just in the past couple of weeks where the data seems to be confirming what we were seeing in the price action.
“So like I said, price is your best leading indicator. We saw prices go up over $60. It led us to believe that about a quarter later we’d start seeing some rig additions. It looks like in the most recent Baker Hughes rig count data that had come out, I think we had 26 or 29 rig additions in one week and then another seven the week after. February’s not over yet, but that latest data point is showing an increase of about 40 rigs month over month, the highest that we’ve had in a long time. That suggests to us that U.S. oil production is going to begin accelerating again, getting up over that 80- to 100,000 barrel a day month over month growth.
DUCs
“Here’s that data series, where we have dark blue, drilled wells; light blue, completed wells on the left axis. And on the right, that would be sort of that stock of drilled-but-uncompleted wells whenever the dark-blue line is above the light-blue line.

“And again, now we’re still at the point where we’re growing that DUC inventory, but the latest DPR that we released – I think it was last Monday or so – we started to see a slight uptick in the number of completed wells, whereas the drilled wells stayed flat overall throughout the course of the month.
“Granted, again, we’re – this is just sort of my hypothesis or I’m speculating as a government employee. I have the right to do that on occasion. We could start to see these lines start to converge, maybe even the completed well start to overtake the drilled wells. Timing is obviously a critical factor; price action is a critical factor. I think hearing some of these company presentations, it seems like a lot of them definitely want to be adding rigs, and to be completing wells.
“Given the productivity that we’re seeing per well continue to hit new highs every single type curve vintage — that suggests that U.S. production is going to hit those new highs. Initially, we didn’t think it was going to get over 10 million barrels a day until probably Q1 or so of 2018. It turns out it happened last November. We now produce more than Saudi Arabia. We do believe we will cross over 11 million barrels per day by the end of 2018.
“We saw the United States production start to increase over the course of 2017 to where we are now. Brazil, their offshore production has continued to increase, they’re bringing new fields online. Libya, they are within OPEC, but they have just been able to get back up to where they were from around 500,000 a day up to a million.
“And where is supply being offset, that supply growth? It’s being offset by Saudi Arabia actively managing their production, probably over-delivering their promises. Nigeria, they’re always kind of up and down, because again, they weren’t subject and now they are. And then Venezuela and Mexico, for example, in those two countries they have had their production go down significantly not so much because they’re actively managing the production, being compliant, they are having their own internal supply problems in terms of just the acceleration of their natural decline rate. I’ve got a chart on Venezuela, so we – you’ll see what I’m talking about there.
“But the real point here is that OPEC cuts are more or less being offset by growth in non-OPEC supply. That’s past. Our outlook for the future over the course of Q2, Q3, and Q4 of 2018, when you aggregate that non-OPEC production growth on a year-over-year basis, those green bars, you can see what I was talking about; how through 2017 world consumption growth was outpacing that. We saw that with our estimates on global inventory withdrawals. By the time you get into Q2 and Q3 and Q4, the swath of new supply coming online is going to more than overtake consumption growth.

“So that is one of the critical factors in our sort of base-case outlook, suggesting that prices from now are going to come down from 62, average about 58, because we feel that the pressure – sort of the mismatch in timing, if you will, from projects, long-lead-time projects coming online, significant acceleration in U.S. shale, is going to outpace that world consumption growth.

“And again, even if wrong on the consumption growth, like I said, there’s probably some risk to the upside. The fact that 2- to 2.5 million barrels a day of growth, that’s really tough for world consumption to meet that.
“And my last slide is, again, is sort of a risk factor that I feel like if you’re an oil analyst, especially if you’re in Washington, D.C. and you talk with folks that are – they have security clearances and deal with folks in the CIA and whatnot, you thought Venezuela was going to collapse. “Okay, it’s going to be today. Oh, no, it’s going to be next week.” And you think it’s going to happen any single minute, and it wasn’t really showing up in terms of any of the actual oil data.
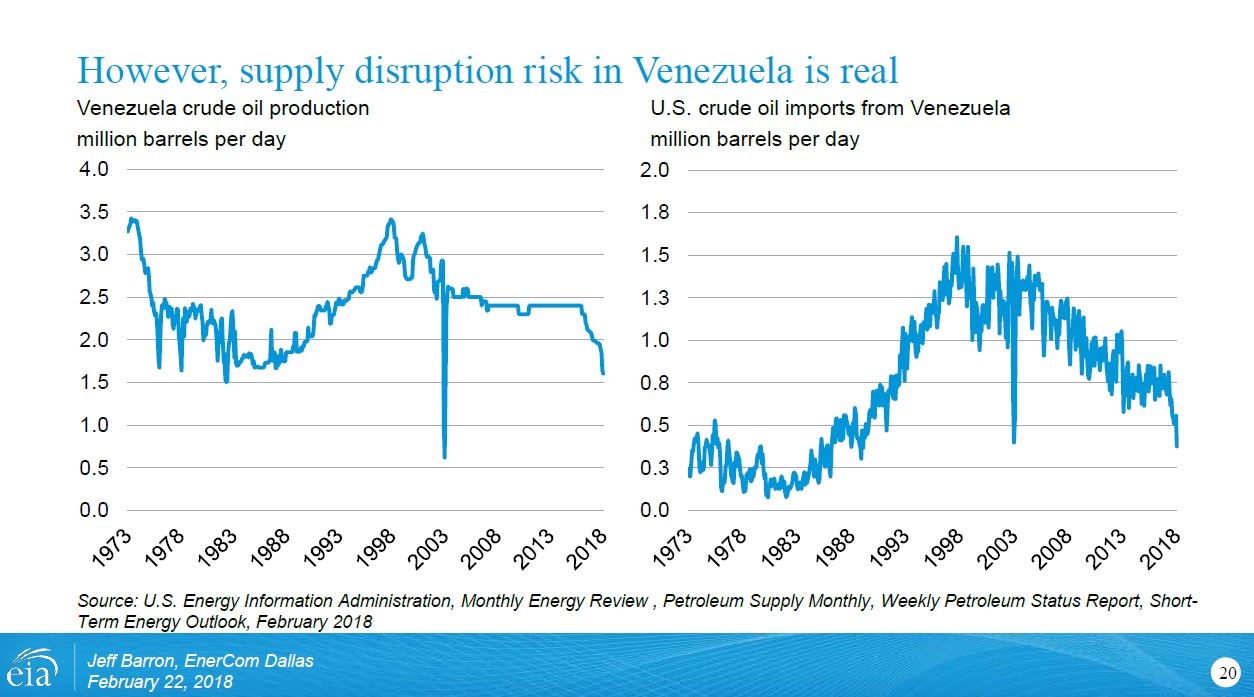
“This is 1973. The chart on the left is just the raw crude-oil production. Our most recent estimates for January of 2018 suggest it’s about 1.6 million barrels per day. If you ignore that 2002, 2003 blip because of their strike, that’s the lowest in 30, 35 years, something like that.
“The one on the right, these are monthly U.S. crude-oil imports from Venezuela. Even though they have had their own problems with managing their supply, they haven’t been investing, all the stuff that we know about, the problems of PDVSA, we were still importing about 800,000 barrels a day or so. It’s 0.8 million barrels per day on this line if you can see from 2013 up through 2017. It’s just been in the past quarter, past couple weeks that we’ve seen those numbers really start to decline. I’ve read some trade press that seems like workers in PDVSA are fleeing the country and going to Colombia. There’s a lot of uncertainty there, folks, is all I’m trying to say.
“The most recent data point that I received this morning from our Weekly Petroleum Status Report is that we imported 174,000 barrels a day from Venezuela last week. And that’s just one data point, obviously. This is a monthly average, but it’s looking like it’s going to continue falling under 400,000 barrels a day, half as much as what we were importing 2013 and 2017. So there’s a non-zero risk of a supply disruption. Just something you want to keep your eyes on.

EIA was established by Department of Energy Organization Act of 1977
The Department of Energy Organization Act of 1977 established EIA as the primary federal government authority on energy statistics and analysis, building upon systems and organizations first established in 1974 following the oil market disruption of 1973. Located in Washington, DC, EIA is an organization of about 370 federal employees, with an annual budget in Fiscal Year 2016 of $122 million.