Well Backlog a Critical Piece of the Puzzle as the Market Seeks to Predict what Happens in a Recovery
DUCs, or drilled but uncompleted wells, have been a major topic of discussion among analysts for more than a year. The idea is that companies drilled wells (roughly half the total well cost) but didn’t complete the wells (roughly the other half of the well cost). Why invest all the capital to complete wells just to produce oil so you can sell it at a money-losing market price?
As drilling slowed after the 2014 price drop, completions slowed even more in the four primary U.S regions (Bakken, Eagle Ford, Permian, and DJ-Niobrara) producing light, tight oil. The result was a backlog of uncompleted wells that have befuddled many who follow and analyze the industry.
Information on the level of DUCs in periods of producer stress can provide insights into upstream industry conditions while a large DUC inventory can also have a significant effect on the size and timing of domestic production rates during a period of increasing oil prices. Turning on completions of existing DUCs can cause production to increase quickly after prices rebound, without causing a significant change in rig count.
With this ghost supply waiting in the wings and industry players ranging from E&Ps to equity/debt analysts to service companies always eager for insights to give them a competitive advantage, analytics companies have taken it upon themselves to develop algorithms that will provide estimates of total DUC numbers in different regions.
Bloomberg Intelligence currently provides DUC estimates and as of September 12, EIA has included a supplement to its monthly Drilling Productivity Report providing monthly estimates of DUCs in the seven key oil and natural gas producing regions covered. These include the Eagle Ford, Permian, Bakken, DJ-Niobrara, Marcellus, Utica, and Haynesville shales. Some other companies currently providing DUC estimates include Drilling Info and Platts/Bentek.
DUC Hunt or Wild Goose Chase?
Ultimately, figuring out the exact number of DUCs is a difficult endeavor. Raymond James Equity Research has called the task “Sisyphean” and publicly stated that “if anyone tells you they know the [DUC] number, they haven’t done the work” and “frankly, any definite answer regarding the DUC question is conveying a completely false sense of precision.”
To examine just how similar or different counts of DUCs can wind up, Oil and Gas 360® compared EIA’s publicly available data with Bloomberg Intelligence’s numbers. The overlapping period of January 2014 to May 2016 for both data sets was covered. Although Bloomberg provides more granular DUC estimates across all producing U.S. plays, we chose to compare the “Big Seven” plays covered by EIA that have been the heart of the shale boom–providing the majority of unconventional oil and gas production growth for the past decade.
The idea is that DUC accounting is an imprecise practice and that further work needs to be done. Much of this is due to the variety and sources of data required to cross-check and verify whether wells have been completed or not. Some companies put out DUC numbers in investor presentations but unfortunately, this is the exception, not the norm.
EIA “Big Seven” DUC Estimate Higher than Bloomberg, Both Moving in the Same Direction
The general trend of increasing DUC count across the seven regions since the beginning of 2014 is corroborated by both EIA and Bloomberg Intelligence, although EIA’s May 2016 count of 5,312 is 63% higher than Bloomberg’s count of 3,267.
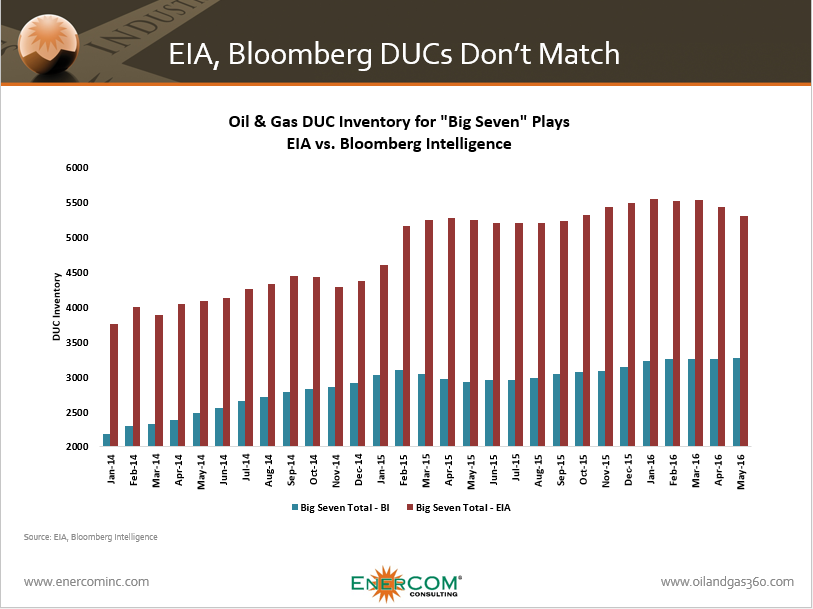
Of course, if both groups’ DUC counts are generally changing with the same direction and magnitude each month, maybe they’re on the right track. After all, both groups indicate that the backlog of total DUCs started to come down in the spring of 2016, as rig counts reached their lowest point in years. In fact, the only major discrepancy in overall direction is seen in late 2014, where EIA’s sudden dip and increase contrasts with Bloomberg’s consistent increase. Bear in mind, this was right about the point when the market shifted violently.
The chart below compares month over month changes in each source’s total DUC count.
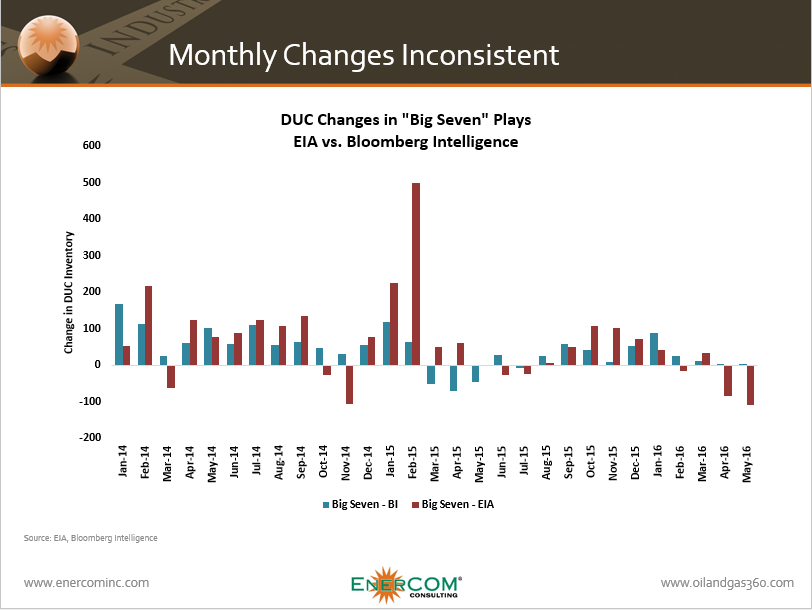
Most noticeable is the huge DUC buildup estimated by EIA in January and February 2015, the same period when E&Ps began to cut drilling activity. While Bloomberg also indicated increases in these months, they were nowhere near the scale of EIA’s estimates. 12 of the 30 months examined show EIA and Bloomberg DUC counts moving in different directions, with March through August of 2015 showing the greatest monthly change discrepancies.
Estimates for Eagle Ford and Marcellus Show Greatest Differences
Oil and Gas 360® also took a look at DUC counts for major regions, with the Eagle Ford and Marcellus DUC counts displaying the most obvious differences. Although both sets of Eagle Ford numbers move in the same direction through 2014, EIA indicates a massive DUC build in early 2015 while Bloomberg indicates a slowdown.
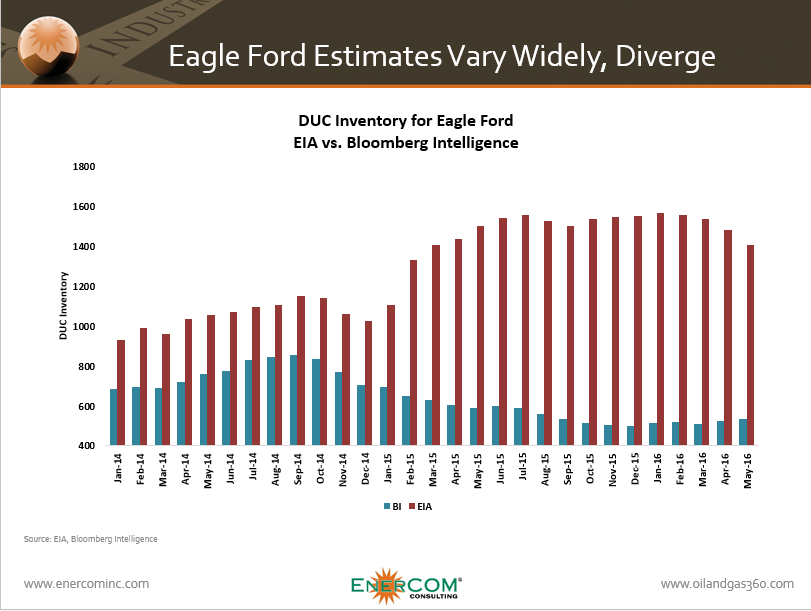
Of all the plays examined, Eagle Ford data seems to have the most problems. The table below shows the wide range of Eagle Ford DUC estimates for the month of October 2015, with a Platts/Bentek number thrown in for further comparison.
|
October 2015 DUC Count – Eagle Ford |
|
| EIA |
1,536 |
| Bloomberg Intelligence |
554 |
| Platts/Bentek |
1,022 |
Marcellus data shows the opposite trend, with EIA estimating well over twice as many DUCs as Bloomberg at the onset. On the plus side, both counts have converged since late 2015 and seem to have moved in the same direction since.
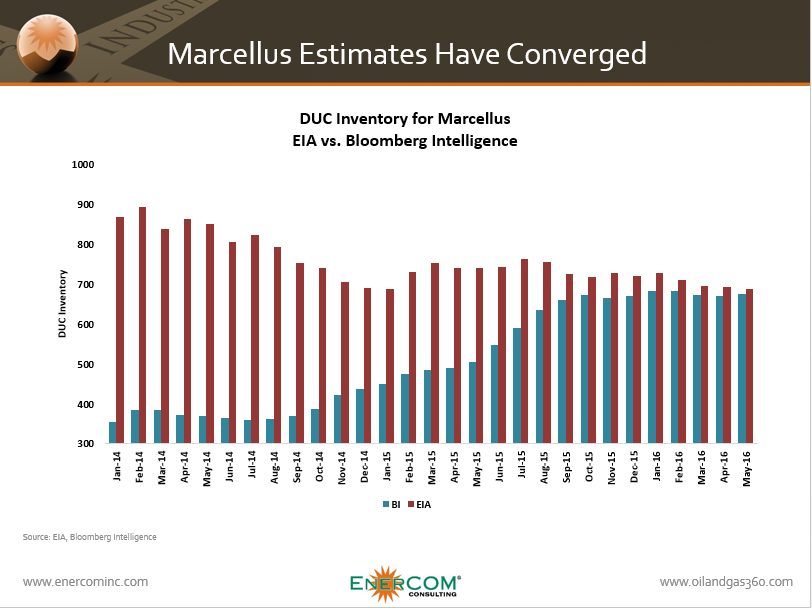
Marcellus trends are hard to interpret without a taking a plunge into the finer data. Decreasing gas prices in the past two years would suggest fewer overall wells being drilled, as shown in EIA’s numbers. At the same time, the Marcellus’s well-known infrastructure problems lend support to Bloomberg’s estimated DUC increase. Wells with difficulty securing takeaway capacity are unlikely to be completed and put online and even wells that have been completed can still be placed on backlog.
EIA and Bloomberg’s Permian DUC counts have generally moved in the same directions, although EIA’s count remains much larger than Bloomberg’s and indicates an accelerating buildup through 2014 and early 2015.

DJ-Niobrara and Bakken counts have also generally moved in the same direction, although EIA continues to provide significantly larger estimates than Bloomberg.

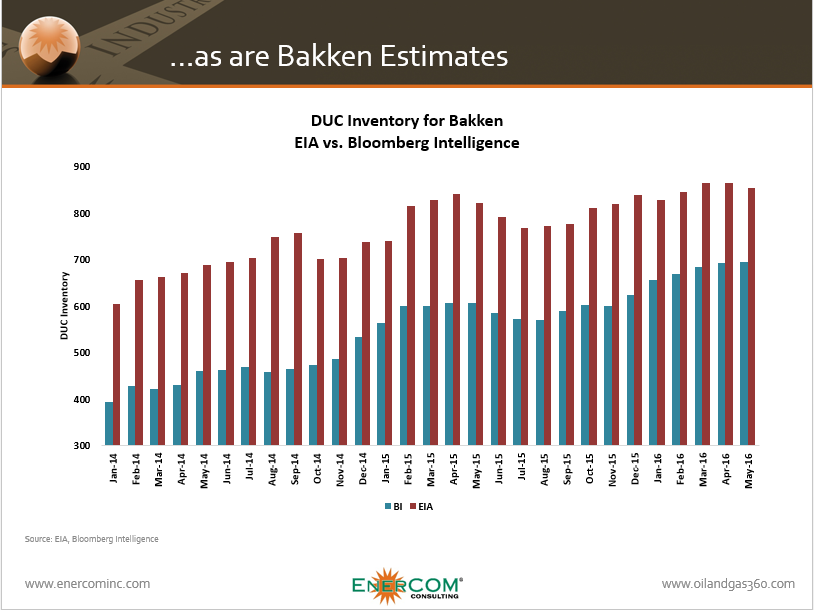
Both sources also indicate that the DUC backlog in the Bakken and DJ started to come down in May 2016. Platts/Bentek’s count in the Bakken is close with EIA’s and not much greater than Bloomberg’s. North Dakota’s Department of Natural Resources also puts out DUC estimates for state activity levels.
|
October 2015 DUC Count – Bakken |
|
| NDIC |
975 |
| EIA |
811 |
|
Bloomberg Intelligence |
607 |
|
Platts/Bentek |
831 |