In the oil and gas industry not everyone hedges all the time, but the vast majority of exploration and production companies have an active hedge book aimed at mitigating risk against volatile commodity markets.
Hedging utilizes a futures contract to lock in a set price (or range of prices) in most cases. A futures contract gives the buyer of the contract the right and obligation to buy the underlying commodity at the price at which he buys the futures contract. Conversely, a futures contract gives the seller of the contract the right and obligation to sell the underlying commodity at the price at which he sells the futures contract.
There is a multitude of ways that hedges are used to protect revenue and ensure that a portion of cash flow is sustained and predictable. Companies will use swaps, costless collars, put options, three-way collars, and several other means to place their hedges at a desired price. Depending on the movement of the commodity price, the hedge will either reap benefits of higher realized prices, or serve as a security blanket against price depreciation.
A hedge can act as insurance, allowing a company to plan for a set amount of cash flow regardless of any price fluctuations. But a hedge is also a bet on the future direction of the oil or gas price. Within the industry, most people have a prediction of what direction commodities are headed and what the future prices are going to be. To most CFOs in the oil and gas industry, this is a frequent assessment, often a daily activity.
Hedges Increase Realized Prices; Settled Contracts v. Mark to Market
Hedge positions are often disclosed by companies and recorded on the income statement as a gain or loss depending on the mark to market value of the hedge book. The number recorded on the income statement will often be a net number encompassing the entire hedge book inclusive of settled derivative contracts and outstanding contracts. Settled contracts means that money has changed hands and the contract is no longer open or active. A ‘mark-to-market’ contract is valued on a daily basis, but remains open and active to future price fluctuations.
Contracts that have been settled have an immediate effect on a company’s bottom line. Mark-to-market contracts can increase or decrease in fair value as the price fluctuates. EnerCom Analytics has sifted through the data to separate derivative contracts into realized and unrealized values for each reporting quarter.
The result of this analysis can provide a glimpse into the effectiveness of each company’s hedges and the realized cash flow associated with the derivative activity. The chart below shows EBITDA for large cap E&P companies, with unhedged EBITDA shown by the gray dotted line, and EBITDA including realized hedges shown by the blue line.
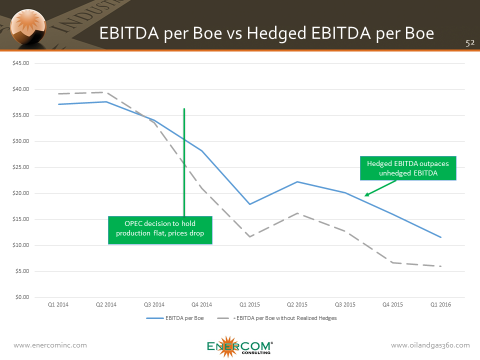
The chart shows the divergence of hedged EBITDA vs unhedged EBITDA. The blue line shows EBITDA including realized hedge gains. In the first two quarters of 2014, when oil price was hovering between approximately $95 per barrel to $105 per barrel, hedges actually pulled down the EBITDA of E&P companies. WTI oil prices fell from $105 per barrel to $91 per barrel during the course of Q3 2014, and the hedged EBITDA is greater than the unhedged.
In Q1 2014, the effect of hedging by the large cap group actually dragged EBITDA down by -3.9%. One year later in Q1 2015, revenue from realized hedges accounted for 19.3% of hedged EBITDA. As a group, EBITDA was $11.63 per Boe, the hedge impact was $6.24 per Boe. By the fourth quarter of 2015, realized hedge revenue accounted for 30.1% of hedged EBITDA.
Through the course of two years from Q1 2014 to Q4 2015, oil and gas sales per Boe declined a total of 59.0% from $52.87 per Boe to $21.68 per Boe. Unhedged EBITDA fell even harder, falling 83.1% from $39.13 per Boe to $6.60 per Boe. Hedged EBITDA fell less than both revenue and unhedged EBITDA during that time, falling 57% from $37.14 per Boe to $15.95 per Boe. For comparison, the oil price fell 63.5% from March 31, 2014 to December 31, 2015.
Could it be said the drop in these number is attributable to the fall in commodity prices? Out of the three metrics (revenue, unhedged EBITDA, and hedged EBITDA), hedged EBITDA fell the least, even falling at a slower rate than the oil price.
Who Hedged their Bet the Best?
The effects of hedging can be relative to any number of different factors; the amount of the production that is hedged, when the hedges were placed, exposure to oil or gas, and the method used to hedge. Looking at realized hedges as a stand-alone value would skew the data towards companies hedged against oil over those hedged against gas, since the price difference would lead to greater gains from oil hedges.
Looking at hedges relative to oil and gas sales presents a cleaner picture of hedge effectiveness, since the oil and gas sales would be largely indicative of the production mix. A company solely producing natural gas would have lower revenue per Boe than a company primarily producing oil and NGLs.
| 3/31/2015 | 6/30/2015 | 9/30/2015 | 12/31/2015 | 3/31/2016 | Average | ||
| AR | 45.5% | 60.3% | 63.5% | 84.3% | 45.5% | 59.8% | |
| RRC | 30.0% | 48.5% | 54.7% | 67.5% | 52.3% | 50.6% | |
| CXO | 40.4% | 20.9% | 35.4% | 48.7% | 91.0% | 47.3% | |
| PXD | 39.8% | 25.2% | 42.7% | 55.5% | 53.3% | 43.3% | |
| DVN | 53.7% | 30.2% | 46.1% | 69.3% | 23.5% | 44.6% | |
| NFX | 34.7% | 26.2% | 34.7% | 76.0% | 28.9% | 40.1% | |
| NBL | 28.4% | 25.9% | 37.1% | 40.0% | 25.2% | 31.3% | |
| FANG | -6.8% | 21.3% | 31.7% | 35.4% | 5.8% | 17.5% | |
| CLR | 4.0% | 1.7% | 1.9% | 3.8% | 10.0% | 4.3% | |
| SWN | 6.8% | 8.3% | 10.0% | 15.0% | 2.0% | 8.4% | |
| APC | 4.0% | 3.5% | 4.2% | 4.8% | 7.5% | 4.8% |
The chart above shows the impact of realized hedges relative to oil and gas revenue. For Antero Resources, from the first quarter 2015 until the first quarter 2016, realized hedges amounted to an average of 59.8% relative to oil and gas revenue. Interestingly, the two companies with the most effective hedge programs are based in the Marcellus and are heavy in natural gas production as opposed to oil. Natural gas price fell 34.7% during this time period, while oil fell 27.2%, a difference, but not large enough to have a resounding impact on the data.
To Hedge or Not to Hedge
The effectiveness of hedging can be reliant on the accuracy of the price prognostication when locking in the hedges. Even in an up market at $100 a barrel, hedging has its place to protect cash flows and drilling budgets. Should a price be locked in at $50 per barrel, $2.50 per Mcf, or will a couple day wait improve the conditions for locking in hedges? The answer depends on whether a company believes the market is bound to improve in a few days or not. If a company believes that prices are certain to rise, then placing hedges at low prices would not be beneficial. To the contrary, if it was determined that prices had to fall in the future, the buy button couldn’t be pushed fast enough.
Whatever method is utilized to hedge against the volatility of oil and gas markets, the effect is similar. Hedges can improve a company’s bottom line, or deteriorate it. In the current commodity environment, hedges can be a lifeline to companies struggling to maintain cash flow. Hopefully their hedges will help oil and gas company management get through the downturn with a bit more sleep.