Post Tagged with: "U.S. Energy Use"

Chart of the Week: Rig Count by Region

Chart of the Week: Rig Count by Region

By Andrew Nichols: EnerCom

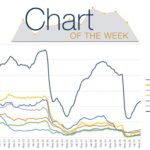
In the past 10 years, we have seen many shifts in the number of active oil rigs in the top 7 regions in the United States. Before 2016, when the price of oil dropped to $29 …

August 13, 2021 - 2:00 pm Analytics, Chart of Week, Oil and Gas 360 Articles
Chart of the Week: Rig Count by Region

Chart of the Week: Rig Count by Region

By Andrew Nichols: EnerCom

In the past 10 years, we have seen many shifts in the number of active oil rigs in the top 7 regions in the United States. Before 2016, when the price of oil dropped to $29 …

August 9, 2021 - 11:26 am Analytics, Chart of Week, Oil and Gas 360 Articles
Chart of the Week: ESG Reports and Stock Price

Chart of the Week: ESG Reports and Stock Price

By Andrew Nichols: EnerCom

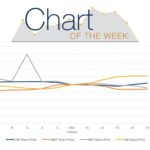
ESG reports are a great way for companies to disclose data on how they impact the environment, social culture, and corporate governance. This practice helps to reinforce a company’s social license to operate and signals to …

August 6, 2021 - 2:30 pm Analytics, Chart of Week, Oil and Gas 360 Articles
Chart of the Week: ESG Reports and Stock Price

Chart of the Week: ESG Reports and Stock Price

By Andrew Nichols: EnerCom

ESG reports are a great way for companies to disclose data on how they impact the environment, social culture, and corporate governance. This practice helps to reinforce a company’s social license to operate and signals to …

August 2, 2021 - 12:49 pm Analytics, Chart of Week, Oil and Gas 360 Articles
Chart of the Week: Correlation Between Natural Gas and Crude Oil

Chart of the Week: Correlation Between Natural Gas and Crude Oil

By Andrew Nichols: EnerCom

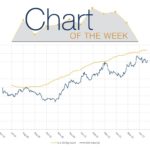
Historically, the price of crude oil and the price of liquified natural gas, or LNG, showed strong signs of correlation. For example, in 2017, the monthly average spot price for a MMBtu of LNG in Japan …

July 23, 2021 - 3:30 pm Analytics, Chart of Week, Oil and Gas 360 Articles
Chart of the Week: Correlation Between Natural Gas and Crude Oil

Chart of the Week: Correlation Between Natural Gas and Crude Oil

By Andrew Nichols: EnerCom

Historically, the price of crude oil and the price of liquified natural gas, or LNG, showed strong signs of correlation. For example, in 2017, the monthly average spot price for a MMBtu of LNG in Japan …

July 22, 2021 - 12:01 pm Analytics, Chart of Week, Oil and Gas 360 Articles
Chart of the Week: Rig Count and Stock Price

Chart of the Week: Rig Count and Stock Price

By Andrew Nichols: EnerCom

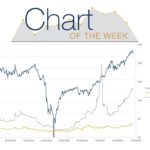
Since August 2020, the number of United States oil and gas rigs steadily increased up to 470 oil rigs. The increase in oil rigs brings in more business and causes the price of shares for service …

July 16, 2021 - 3:30 pm Analytics, Chart of Week, Oil and Gas 360 Articles
Chart of the Week: Rig Count and Stock Price

Chart of the Week: Rig Count and Stock Price

By Andrew Nichols: EnerCom

Since August 2020, the number of United States oil and gas rigs steadily increased up to 470 oil rigs. The increase in oil rigs brings in more business and causes the price of shares for service …

July 14, 2021 - 3:30 pm Analytics, Chart of Week, Oil and Gas 360 Articles
Chart of the Week: Rig Count and Stock Price

Chart of the Week: Rig Count and Stock Price

By Andrew Nichols: EnerCom

Since August 2020, the number of United States oil and gas rigs steadily increased up to 470 oil rigs. The increase in oil rigs brings in more business and causes the price of shares for service …

July 12, 2021 - 1:16 pm Analytics, Chart of Week, Oil and Gas 360 Articles
Chart of the Week: Retail vs. Institutional Investors in Energy

Chart of the Week: Retail vs. Institutional Investors in Energy

By Andrew Nichols: EnerCom

Traditionally, individuals make their investments by hiring a professional organization to manage their money in the market and make decisions on their behalf. Institutional investing is not the only way to buy into the market though. …

July 2, 2021 - 3:30 pm Analytics, Chart of Week, Oil and Gas 360 Articles
Chart of the Week: Retail vs. Institutional Investors in Energy

Chart of the Week: Retail vs. Institutional Investors in Energy

By Andrew Nichols: EnerCom

Traditionally, individuals make their investments by hiring a professional organization to manage their money in the market and make decisions on their behalf. Institutional investing is not the only way to buy into the market though. …

June 29, 2021 - 3:00 pm Analytics, Chart of Week, Oil and Gas 360 Articles
Chart of the Week: Retail vs. Institutional Investors in Energy

Chart of the Week: Retail vs. Institutional Investors in Energy

By Andrew Nichols: EnerCom

Traditionally, individuals make their investments by hiring a professional organization to manage their money in the market and make decisions on their behalf. Institutional investing is not the only way to buy into the market though. …

June 28, 2021 - 1:10 pm Analytics, Chart of Week, Oil and Gas 360 Articles
Chart of the Week: Power Supply and Demand Amid Texas Heat Wave

Chart of the Week: Power Supply and Demand Amid Texas Heat Wave

By Andrew Nichols: EnerCom

The Electric Reliability Council of Texas (ERCOT) is an independent system operator that manages the flow of electric power to Texans and represents about 90 percent of the state’s electric load. Over the past couple of …

June 21, 2021 - 3:00 pm Analytics, Chart of Week, Oil and Gas 360 Articles
Chart of the Week: Crude Demand Returning Post COVID-19

Chart of the Week: Crude Demand Returning Post COVID-19

By Andrew Nichols: EnerCom

Over the past decade the United States shifted the trends in crude oil imports and exports. U.S. oil imports peaked at almost 11 million barrels of oil a day in late 2006. Since then, crude oil …

June 18, 2021 - 3:00 pm Analytics, Chart of Week, Oil and Gas 360 Articles
Chart of the Week: Crude Demand Returning Post COVID-19

Chart of the Week: Crude Demand Returning Post COVID-19

By Andrew Nichols: EnerCom

Over the past decade the United States shifted the trends in crude oil imports and exports. U.S. oil imports peaked at almost 11 million barrels of oil a day in late 2006. Since then, crude oil …

June 14, 2021 - 11:17 am Analytics, Chart of Week, Oil and Gas 360 Articles
Chart of the Week: Gasoline Demand Post-Covid 19

Chart of the Week: Gasoline Demand Post-Covid 19

By Andrew Nichols: EnerCom

The Energy Information Administration (EIA) reports the number of miles traveled by vehicles which is a great indication of demand for hydrocarbons. On a monthly basis, the number of vehicle miles traveled increased in the first …

June 11, 2021 - 3:30 pm Analytics, Chart of Week, Oil and Gas 360 Articles
Chart of the Week: Gasoline Demand Post-Covid 19

Chart of the Week: Gasoline Demand Post-Covid 19

The Energy Information Administration (EIA) reports the number of miles traveled by vehicles which is a great indication of demand for hydrocarbons. On a monthly basis, the number of vehicle miles traveled increased in the first half of the year …

June 9, 2021 - 3:30 pm Analytics, Chart of Week, Oil and Gas 360 Articles
Chart of the Week: Gasoline Demand Post-Covid 19

Chart of the Week: Gasoline Demand Post-Covid 19

The Energy Information Administration (EIA) reports the number of miles traveled by vehicles which is a great indication of demand for hydrocarbons. On a monthly basis, the number of vehicle miles traveled increased in the first half of the year …

June 8, 2021 - 3:44 pm Analytics, Chart of Week, Oil and Gas 360 Articles
Chart of the Week: U.S. Energy Use in 2014

Chart of the Week: U.S. Energy Use in 2014

Petroleum, NatGas, Coal & Nuclear Delivered 89% of U.S. Energy in 2014

U.S. Energy Use: in its September release of the second Quadrennial Technology Review (QTR), AN ASSESSMENT OF ENERGY TECHNOLOGIES AND RESEARCH OPPORTUNITIES, the U.S. Department of Energy …

September 14, 2015 - 4:29 pm Chart of Week, Oil and Gas 360 Articles