Wednesday, May 6, 2026

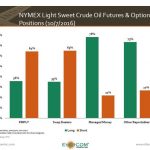
E&Ps Implementing Variety of Hedging Strategies

Hedging programs that E&Ps have in place in 2016 vary considerably. The chart below shows the range of oil and gas production for several E&Ps covered by hedging contracts. Pioneer Natural Resources (ticker: PXD) and Cimarex Energy (ticker: XEC) have hedged the largest portions of their remaining production at 85/75 and 80/90 percent, respectively, for oil and gas. This chart

Crude Oil Futures:  Who’s Long and Who’s Short?

A presidential commission tracks the crude oil positions that are reported each week: this week producers and processors are short, while managed money is long oil In its Weekly Commitment of Traders Report released every Friday, the United States Commodity Futures Trading Commission (CFTC) breaks down the number of outstanding short and long NYMEX futures and options contracts for light, sweet

Is the U.S. Government Too Big to Fail?

Assets: South of $5 Trillion; Liabilities: North of $21 Trillion In February of each year, the Government Accountability Office puts out an updated snapshot of the books, written in plain language. Since Congress is working and this is an election year, it’s prudent to revisit the basic assets and liabilities graph published in the latest Financial Report of the United States

U.S. Gas Production, Consumption Hits Record in 2015

The market for natural gas continues to grow as the U.S. currently produces and consumes more gas than ever before, according to EIA’s 2015 Natural Gas Annual. Prices for consumers continue to decline, although residential pricing for heating remains highest in the Eastern United States. Net imports also continue to decline as the country starts to export more natural gas

DUCs Amok? Oil and Gas 360® Examines Dueling EIA and Bloomberg Backlog Data

Well Backlog a Critical Piece of the Puzzle as the Market Seeks to Predict what Happens in a Recovery DUCs, or drilled but uncompleted wells, have been a major topic of discussion among analysts for more than a year. The idea is that companies drilled wells (roughly half the total well cost) but didn’t complete the wells (roughly the other

History Says the Right Price for Oil is $50

EnerCom Analytics’ September Industry Trends Report Examines Oil Prices The current price of oil may feel low given the fading memories of $100 per barrel oil back in 2014. But in a longer term historical context, we are on the high end of the curve at today’s prices. EnerCom Analytics looked at historical monthly crude oil prices between 1974 and August 2016. 

Oil Market Sentiment on Wild Ride After 2015

WTI Volatility Index at Elevated Levels Since Price Crash Prior to the fall 2014 crash in oil prices, volatility in the oil markets had been on a steadily decreasing trend. An examination of futures volatility in the post-crash period, however, suggests a new normal of heightened uncertainty in pricing outlooks with wide-reaching implications. As WTI plunged from $100 to $40 per

OPEC Crude Imports by U.S. Consistently Decrease, while Non-OPEC Imports Increase

Total U.S. Crude Oil Imports Decline 4% from 2010 According to the EIA, U.S. imports of crude oil from OPEC nations have been consistently decreasing since 2013. On the other hand, non-OPEC imports have been consistently increasing, driven primarily by Canadian flows. Total imports per day in 2016 currently stand roughly even with 2010 levels at 7,151 Mboe/d, a 4%

U.S. Spent $991 Million per Day on Petroleum Products in 2015

Every day in 2015, the United States spent $991 million on petroleum consumption, the lowest daily total since 2008. Consumption levels in the U.S. have decreased slightly to 19.72 MMBoepd since peaking in 2007 at 20.94 MMBoepd. To determine spending levels, the overall oil consumption in the U.S. was multiplied by the SEC standard oil price for that year. The

U.S. Holds More Total Oil Resources than Any Other Country According to New Estimates

Data includes estimates of yet to be discovered resources The U.S. has taken a new place atop the list of countries with the largest recoverable oil resource potential in the world. This places the U.S. ahead of Russia and Saudi Arabia. For the U.S., more than 50% of the remaining oil reserves are located in unconventional shale plays. Texas alone

US energy production and flow

Total U.S. Energy Production Up 2% YoY, 80% from Fossil Fuels

Domestic U.S. energy production of 89 quadrillion Btu accounted for 80% of U.S. energy supply: EIA U.S. energy production totaled 89 quadrillion Btu in 2015, according to the latest information from the EIA. Domestic production increased 2 quadrillion Btu, or roughly 2%, year-over-year. The majority of that production – 80% — came from fossil fuels, according to the agency. Gross withdrawals

Dow Jones Industrials – Is the Money Flow a Good Indicator of Market Direction?

Bullish or bearish? The chart above shows the total amount of money since August 2, 2011 that has been invested in the Dow Jones Industrial Average (DJIA) – the index – by institutional investors and retail investors via various forms of investment vehicles. In total more than $56 billion has been invested in the DJIA since Aug. 2011. This could