“Unlocking the key” to unconventional plays is a popular moniker in today’s oil and gas market. Among the trickiest of plays to master is the Utica Shale, located across Maryland, New York, Ohio, Pennsylvania, Virginia and West Virginia.
The Utica lies beneath the Marcellus Shale, which was first discovered in 2004 by Range Resources (ticker: RRC), and has roughly matched its predecessor in terms of drilling productivity per rig. While discovered after the Marcellus, the Utica is estimated to be twice the size (170,000 square miles). The United States Geological Survey estimates mean reserve amounts of 940 million barrels of oil and 38 Tcf, while the Ohio Geological Survey believes the region holds 8.2 billion barrels and up to 15.7 Tcf.

Utica History
The bulk of Utica drilling activity is situated to the east of the Great Lakes, but the shale was first discovered in Quebec, Canada. Forest Oil officially announced the discovery in April 2008, with two vertical wells producing 1 MMcfe/d at depths of 4,800 feet. Talisman Energy began Quebec Utica operations the following year, but overall activity was limited. The province of Quebec essentially ended further drilling opportunities when it issued a hydraulic fracturing moratorium in March 2012. New York and Maryland currently hold similar restrictions.
During the Quebec exploratory phases, Chesapeake Energy (ticker: CHK) claimed a Utica discovery in Ohio in September 2011. Its four completed wells averaged a depth of 5,280 feet, and three wells in the liquids rich portion averaged returns of 2,051 BOEPD. The other well in the dry gas window reached a peak rate of 6.4 MMcf/d. CHK management described the play as “world-class” and snapped up roughly 619,000 gross acres, increasing activity through joint ventures as it remained the primary operator.
Well permits quickly accelerated, as the Ohio Division of Natural Resources approved more than 1,000 permits from 2010 to 2013. A report from the state also credited the shale to increasing oil and gas jobs by 30%, while providing wages that were 68% higher than the state median.
Today, the Energy Information Administration’s (EIA) most recent Drilling Productivity Report shows gas production from the Utica is 67% greater than the Bakken and its oil production exceeds output from the Marcellus. Overall gas production has grown at a monthly compounded rate of 6% since January 2012.
Utica Shale Characteristics

While the resources and magnitude of the Utica Shale certainly make it an attractive play, the technical aspects are equally challenging. In a study by Penn State University, the so-called fairway of the Marcellus Shale ranges in depth from about 5,000 to 8,000 feet. The Utica, on the other hand, ranges from 6,000 to 10,000 feet in Ohio and greater than 12,000 feet across sections of Pennsylvania.
The play is highly pressurized – much more than the Marcellus, its metaphorical bunkmate. Rice Energy says its bottom well pressure is routinely above 10,000 pounds per square inch, and has seen pressure gradients as high as 0.88. Even though the two shales are geologically close, the respective rocks have historically reacted much differently to hydraulic fracturing operations. You would be hard pressed to find a geologist who says we aren’t still in the early stages of the learning curve on unconventional development, but the Utica is arguably at the top of the list.
A Product of the Shale Boom
Last year, the play’s growing popularity garnered a position on the EIA’s Drilling Productivity Report, becoming the first play to be added to the assessment. The regional production has become a factor almost overnight; its forecasted volumes for July 2015 are twice the amount from September 2014 and 16 times greater than January 2012. In the Drilling Productivity Report for June 2015, the Utica is the only major shale play to record increases in both oil and gas output.
In a commentary piece for The Wall Street Journal, Donald Luskin and Michael Warren of Trend Macrolytics LLC dismissed the notion of M. King Hubbert’s “peak oil” theory, and the Utica is a perfect example of how gains in technology and efficiency have catapulted the United States to the world’s greatest hydrocarbon producer. “Hubbert’s Curve has been trumped by Moore’s Law,” the piece says. “There will be no limits to growth in the global economy in a few years when, thanks to American ingenuity and entrepreneurship unleashed upon shale formations world-wide, oil—like transistors—becomes, for all practical purposes, free. And the lower oil prices go, the more money the frackers can make.”

Utica Shale Makeup
The varying geology of the Utica Shale changes almost county-to-county, as the predominant resources can shift from condensate to rich and even dry gas in just a span of a few dozen miles. Exploration stages, relatively speaking, are still in the early stages, but the majority of dry resources are believed to be in Pennsylvania and West Virginia while Ohio houses more of the rich and condensate product. Since the dry gas window is much larger than the others, operators are continuously updating and adjusting expectations on the deep play.
E&Ps across the oil and gas sphere have slightly reduced their liquids-focus in the face of the commodity downturn. Prior to the game-changing OPEC meeting in November 2014, 82% of rigs in the United States were drilling for oil. In the latest update from Baker Hughes, that number was slipped to 74%. The cumulative rig count in Ohio, Pennsylvania and West Virginia has fallen by about 35% (86 from 131) in that time frame, while the running rigs in Texas and North Dakota have fallen by nearly 60% (440 from 1,081) in the same period.
How Big is the Dry Gas Window?
In March 2015, Seneca Resources announced a test well in Tioga County, PA returned an IP rate of 22.7 MMcf/d. The only catch was that the well was drilled to 12,200 feet and received 30 fracing stages, which may indicate how truly difficult it is to penetrate the rock. The results still present a measure of success, considering the Utica was initially believed to be predominantly in Ohio. Instead, it reaches all the way to northern Pennsylvania and is presumably economical in New York. The Utica’s viability in Tioga County was confirmed by Royal Dutch Shell (ticker: RDS.B) late in September 2014, with two test wells returning initial production rates of 11.2 and 26.5 MMcf/d, respectively. In a show of gamesmanship, Shell increased its acreage in the region by more than 50% before announcing the well results.
However, additional northern Utica development is met with a figurative roadblock at the New York state border. Governor Andrew Cuomo placed a hydraulic fracturing moratorium in 2008 and refuses to lift it, citing a lack of true understanding on its long-term effects. Landowners failing to benefit from mineral rights packages are threatening the state with lawsuits and even secession.
Dry Gas Update: Pennsylvania and West Virginia
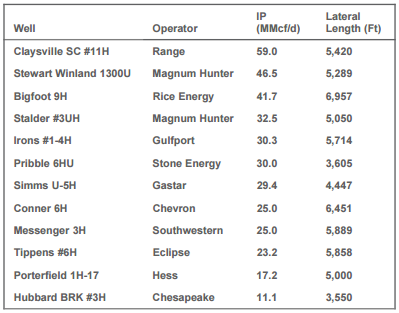
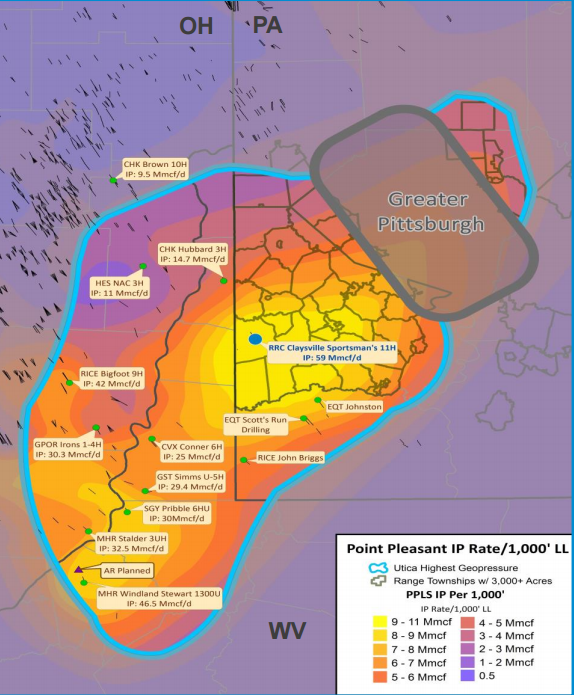
Some believed the liquids-rich window in Ohio was the sweet spot of the Utica, but a pioneer of the Appalachia sent that belief for a loop last year. In December, Range Resources announced a record-setting, 59.0 MMcf/d 24-hour IP well in Washington County, Pennsylvania. The well cumulatively produced 1.2 Bcf by mid-May, according to company representatives, and is the greatest producing well to date in the entire Appalachia region. Another well in the county was brought online late in the quarter and returned a 24-hour IP rate of 31.3 MMcf/d. With more than 5,300 wells in Pennsylvania, RRC is the state’s most active driller.
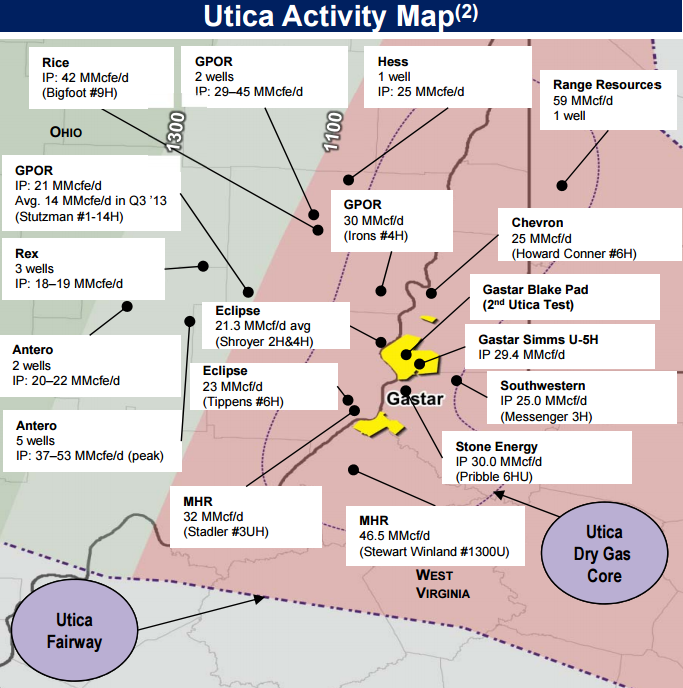
The area of Range’s success in southwestern Pennsylvania is occupied by a handful of other industry mainstays including EQT Corp. (ticker: EQT) and Magnum Hunter Resources (ticker: MHR). EQT plans on drilling five wells in 2015 and places costs at $12 to $17 million apiece, considering its target depth is 13,500 feet. MHR was drilling up to 11,000 feet (not including 6,000 foot laterals) at costs of up to $12 million per well. A Utica well in Tyler County, West Virginia, tested at a peak rate of 46.5 MMcf/d in October and was the previous Appalachia record holder before the announcement from RRC. Other operators like Chevron Corp, (ticker: CVX), Gastar Exploration (ticker: GST), Southwestern Energy (ticker: SWN) and Stone Energy (ticker: SGY) have reported similar rates.
The Hydrocarbon Melting Pot: Ohio
Ohio is investing $2 million to find a slogan to attract more tourism, but the eastern edge of the state has had no problem bringing in exploration and development companies. Some of its counties, including Belmont, Guernsey, Monroe and Washington are flush with resources ranging from dry gas to condensate.
In Monroe, MHR’s Stalder Pad on the eastern side returned an IP rate of 32.5 MMcf/d (97% gas). CONSOL Energy’s (ticker: CNX) operations in the area are just getting started, but the company has already instilled type curves for the dry and wet Utica areas at 2.4 and 1.9 Bcfe per 1,000 lateral feet, respectively. The estimates beat the company’s dry type curves of Pennsylvania and West Virginia, which are estimated at 1.8 Bcfe for the same lateral length.
Tightened Spacing
Gulfport Energy (ticker: GPOR) speaks highly of the region and has backed up its opportunistic approach by securing approximately 60,000 net acres for roughly $700 million in two separate transactions since April 2015. The acreage is still in the early stages of development and type curves are expected to be announced in Q3’15. In its latest conference call, management said current economics involve drilling an 8,000 foot lateral at $9.5 million, but are experimenting with different techniques.

Management believes the company is the largest stakeholder in the dry gas region of Ohio, providing a relative benchmark for returns in the area. “We have some pads that are performing very, very well at 750-foot spacing, and we have some other pads that we’ve done 500-foot spacing,” said Mike Moore, President and Chief Executive Officer. Current frac stages are about 180 feet apart and include 1,500 to 1,800 pounds of sand per linear foot.
Similarly, Eclipse Resources has reduced its spacing to 730 feet from 1,000 feet and will announce results in Q3’15. The downspacing, if successful, will increase its drilling locations by roughly 20%. Estimates for dry gas EURs range from 2.1 to 2.7 Bcfe per 1,000 feet as the play extends to the east. The company has established seven type curves for the varying aspects of the play.
The Heavy Hitters

Chesapeake Energy has become more and more particular on Utica completion techniques ever since it entered the play in 2011. In 2015, CHK anticipates average completed wells costs of $8.2 million with 7,900 foot extended laterals and 41 frac stages. Gross type curves are set at nearly 1.6 MMBOE, and EURs have increased by approximately 20% as part of the new completion techniques in the condensate window of Columbiana County.
Rice Energy (ticker: RICE), involved primarily in Belmont, Greene and Washington counties, is in the learning stages of Pennsylvania Utica development but has established itself as a low-cost producer in the Ohio region. The company has 302 dry gas locations that hold a breakeven price of $2.35, while its 52 wet locations have a breakeven price of just $2.05. At $2.50 NYMEX prices, Rice’s wet acreage yields a 20% return. A company goal is to reduce its lateral costs to $1,500 per foot.
Antero Resources (ticker: AR) is not far behind, offering breakevens at $2.20 and $3.13 for dry and wet Utica. Overall, AR has the lowest 3-year finding and development costs of any producer in EnerCom’s 88-company Weekly Benchmarking Report. AR believes it holds 149,000 net acres in the core of the play.
The Utica is Just Beginning
Goldman Sachs reports the Marcellus/Utica region will account for 85% of net production growth in the United States from 2014 to 2018. Raymond James estimates the Utica will have a “somewhat similar” production profile to the Marcellus, which currently accounts for nearly 40% of natural gas production in the United States.
Goldman believes the buildout will result in a $21 billion of investment to reverse pipelines and build new pipelines from Appalachia to the support substantial changes in gas flows for supply to meet demand. The heavy investment in the area will benefit producers, consumers and residents alike as the Utica plays its part in making the United States the greatest hydrocarbon producer in the world.
[box type=”info” size=”small” style=”rounded” border=”full”]
[yks-mailchimp-list id=”a32a355444″ submit_text=”Closing Bell Sign-up”] [/box]